Executive Overview
Deploying Six Sigma in a service or transactional environment usually entails working with various information systems, which may seem “data rich” at first glance but are, in fact, data poor due to their design and implementation. This case study looks at one company’s experience deploying and implementing a set of Six Sigma projects within the context of a robust data systems infrastructure – the establishment of which is a fundamental first step in developing an effective transactional Six Sigma initiative. With such an infrastructure in place, projects can proceed more rapidly and with greater success.
Six Sigma in Service & Transactional Environments
Six Sigma is an important business process improvement method that has significantly impacted the manufacturing world and has saved companies billion of dollars. Many claim that the same benefits can be derived away from the manufacturing floor, both in the transactional side of companies and in service companies, even though there have been problems in doing so. As a data-driven methodology, it’s no surprise that the largest problem in transplanting Six Sigma into services is the presence of inadequate data and the high cost of obtaining good data. In fact many see inadequate data infrastructures as the key hurdle in deploying Six Sigma in transactional and service environments.
Company Description
One company that jumped this hurdle is a mid-sized business in the financial services market. The company hired a GE-trained Master Black Belt to lead it’s Six Sigma effort, but, due to it’s size, it has not built the Six Sigma infrastructure that is typically found in larger companies.
However, like other Six Sigma companies, the stated goal of this company’s Six Sigma program is to provide business managers with the information and tools they need for making data-driven decisions in their daily work and for driving ongoing process improvement efforts.
The company’s product is data. They deliver this data to their customers in the form of custom reports. Customers request data from the company, and the company generates a report specific to that customer’s request. In turn, these reports help the company’s customers conduct business in a more predictable manner by maximizing intelligence and minimizing the risk associated with lack of knowledge and information.
Through customer interviews, the company determined that the most important Critical-To-Quality (CTQ) characteristic for their reports is cycle time: the time from when the customer requests the report to the time the report is issued. Based on the customer requirement associated with this cycle time CTQ, the company published a commitment to issue reports within 24 hours of their request.
Because the company operates in many regional offices, each office had developed different ways for meeting customer needs, and none collected data to definitively measure report cycle time. Instead, different employees had evolved a variety of systems for tracking work load and responsiveness.
One office, for example, wrote up the customer’s request for a report on a differently colored cover sheet for each day of the week. A request that came in on a Monday was recorded on a blue cover sheet; Tuesday was written up on yellow page, and so forth. This created a highly visible system for keeping track of how old requests were, and for focusing effort on the oldest requests first. Other offices tracked work-in-progress by literally digging through employees’ in-baskets to see what requests they were working on and how old they were.
Building a Measurement System
Upon reviewing these practices, it quickly became apparent to the master black belt (MBB) that the company needed to set up a measurement system to quantify its ability to meet the report turnaround CTQ.
The MBB began compiling data using batch queries against the production software, the results of which were imported into Excel. Cycle Time was calculated by subtracting Date/Time stamps. By doing this, the MBB quickly learned that there were huge disparities among offices in the operational definitions used to calculate cycle time.
For example, the customer’s requests for a report arrived via fax, telephone or online. Most of the offices started counting the cycle time when the report request was entered into the production system, which was appropriate only if the company representative began working on the report right away. However, sometimes, especially when the request arrived via fax, the request might sit in a receiving basket overnight before somebody picked it up and put it in the system the following morning. This meant that the cycle-time calculation did not include the time the request sat in the receiving basket for locations that followed this convention.
Receiving a request via fax after the close of the business day also raised another question: does 24-hour turnaround time mean 24 business hours (three eight-hour business days) or 24 hours of elapsed time? After a thorough discussion of these issues, the company standardized on the following definitions:
- Report Cycle Time = Time Service = Turnaround Time = The time (in hours) between when an order is placed by the customer and when the report is sent.
- The maximum time accrued over a weekend is 24 hours. In other words, a report that is requested at 9 p.m. Friday and delivered to the customer at 11 a.m. on Monday has a cycle time of 26 hours.
Making these decisions forced the company to reengineer its customer-tracking information systems. In one specific example, the information system did not allow the users to back-date the start time. This worked fine when representatives took a customer request over the telephone and logged it directly into the system, but it provided no such support for faxed requests. For example, if a customer faxed a request for a report at 9 p.m., the representative working of the request might not start processing it until 11 a.m. the following day. The information system populated the time they started working on the report (11 a.m.) rather than when it actually came in (9 p.m. the night before). This caused huge data distortions.
Ultimately, the new definitions were documented, and changes were made to the in-house tracking system to support the new practices. These practices were built to support customer’s Critical to Quality measurement: Order Cycle Time from when the customer thinks the order was placed. It was an iterative approach where the MBB worked with a small group of process owners to test the operational definitions, and simultaneously worked with the in-house IS team to modify the business system to support the new definitions. This was essential so that the MBB could be sure that the operational definitions were valid.
Throughout this process, the MBB continued to capture data manually from the business system, which helped her form an intimate knowledge of the data and data systems, as well as clarify the issues presented by work flow and disparate operational definitions.
Once the revisions to the data systems were complete and fully supported the new operational definitions, the MBB implemented Hertzler GainSeeker Suite to automate the data collection process. Every night, the business system queries the database and saves the results in a text file, logging the start time and completion time for every report, as well as related information.
The GainSeeker Suite automatically reads this data, calculates applicable cycle times and then stores the data in a summary database. GainSeeker performs statistical analysis on the data, and generates exception reports for the process owners. In these reports, the process owners have what they need to understand the reality of their performance, make better decisions, implement process improvements and control the quality and timing of their deliverables to customers.
With this in place, the MBB brought all the company’s report agents together for two days to train them on the operational definitions, how to use the enhanced information system and how to use the GainSeeker tool. At the conclusion of this training, the MBB had a reliable measurement system for making meaningful calculations of the CTQ: Cycle Time to Issue a Report. The performance level at this time was that 25.6 percent of all reports took more than 24 hours to process.
At the same time the MBB was generating the operational definitions and building the IS infrastructure, she used a Cause & Effect Matrix to identify the critical Xs that impact the CTQ Y. They included:
| Critical X | Description |
|---|---|
| Work in progress | How many reports are in the queue? |
| Overall workload | What other projects are on the rep’s plates? What are their other assignments? How many telephone calls did each rep take? |
| Customer | What customer made the request? |
| Processing team | Which processing team is the report assigned to? With the consolidation of various local offices, the regional offices divided their work forces into teams specializing in certain regions and certain customers. Key national customers are assigned to national offices. |
| Office | Processing office. |
| Product Type | There are several types of reports, some with different target cycle times. |
| Rush orders | Is this a rush order? |
| Electronically ordered | Yes (No = phone or fax order) |
| Processor | ID of the person completing the report. |
These Xs became traceability fields in the GainSeeker database, which allowed the MBB to evaluate the impact of changing X-related values on the performance of the Y value of report turnaround time.
GainSeeker lets the user tag Y data with traceability, or X, data. For example, the system might record the total cycle time for completing the report (Y), and at the same time tag that data with such supporting information as order type, processing team, which office and so on. The user can then evaluate the relationship between the outputs (Y) based on the behavior of the various inputs.
Leveraging the Measurement System to Drive Project Selection
With the baseline established and the measurement system in place, the MBB began to use the data to identify and prioritize possible black belt projects. Here is a partial list of the projects that were identified and completed within one year:
- Evaluate and revise how incoming telephone calls are handled in the office, resulting in a major restructuring of how work is assigned and managed within the office.
- Track and reduce Work In Process at the end of each business day.
- Link report data to billing process to mistake-proof the billing process.
- Reduce report cycle time.
- Reduce the percentage of reports that are delayed by waiting for information from the customer.
Within a year of deployment, the effort resulted in substantial cycle time improvements, from more than 25 percent of the reports taking longer than 24 hours to only having 1.5 percent take longer than 24 hours. This is a 94 percent decrease in defects!
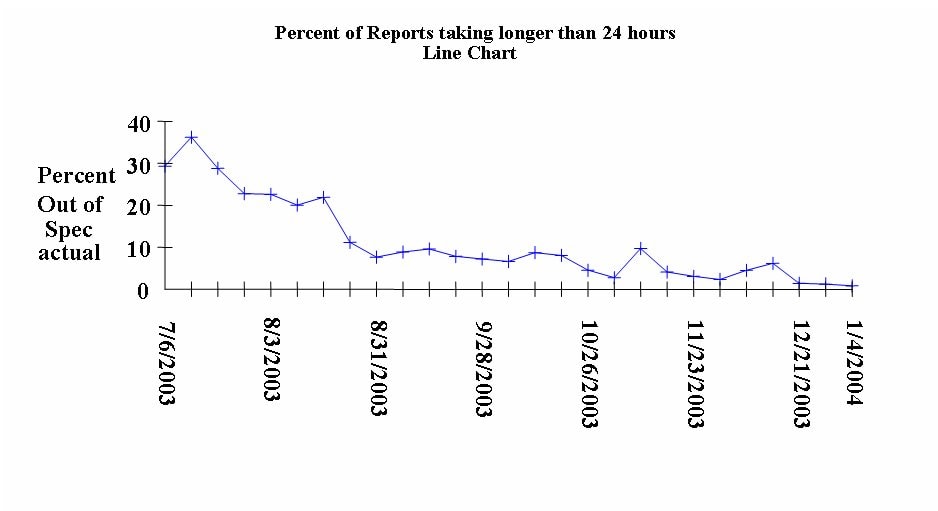
The following chart shows the reduction in the percentage of reports that took more than 24 hours to turn around.
This reduction in cycle time has had at least two significant benefits. First, in the highest-volume office, the company has used the time-service information to win more business from its largest customers. Second, the company has consolidated several small offices into some of the larger offices, resulting in an enormous increase in report volume at those larger offices. By reducing the cycle time on reports they have been able to handle this increase in volume with minimal increase in staff, resulting in increased profitability.
Lessons learned
Upstream manual data collection – According to the MBB who led the cycle-time-reduction initiative, the initial effort of capturing data manually first paid huge dividends as the deployment progressed. By engaging in manual data collection, the MBB was able to gain valuable insight into the nuances of the various operational definitions used by the process owners, and in the way the information system supported or did not support those definitions.
While an automated system has proved invaluable for collecting and analyzing massive amounts of transactional data, it is essential to develop an intimate, hands-on relationship with data in order to understand the system that produced it. This principle applies to any initiative or project that is focused on deriving long-term, leveraged benefit from an automated measurement system.
This lesson was reinforced later when the MBB implemented a similar measurement system in another part of the business. In this second application, she believed she knew enough about the system to go straight to automated data collection, but she discovered that there was no shortcut to forming a thorough understanding of the data by collecting it manually first. The second application took far longer to deploy, with many more false starts before realizing success.
Education, involvement and support – Good Information Systems people are a tremendous asset in producing data, but they typically don’t or aren’t mandated to understand the business issues, and they often don’t understand how their users really use their systems. As well, good process owners and business leaders don’t often understand the people and systems that capture and generate important operational data. Both sides of this issue make it critical that the black belt or MBB connect data and those who own it with the business and those who are responsible for its performance.
This is done by understanding the customer’s requirements, systematically identifying the critical Xs that impact those requirements and then building common operational definitions of both the X and Y data. With clear vision of these business issues and the data that support them, the organization can ensure that the IT systems and people support these operational definitions. Education of the IS people, the process owners and executive leadership is essential.
Recognition of inherent data structure – The inherent structure of the data will impact what you can and cannot do, and there will always be limits on how much you can restructure the data to meet your needs. These limits might be due to resource challenges (especially in IS staffing), in the amount of data users are able to enter or in the sheer volumes of data required to generate meaningful analyses.
In this situation, the MBB made some changes to the business software, such as allowing users to backdate report dates. Fortunately, she had good support from IS and ran into very few limitations on that score. But this is not always the case, and when it isn’t, you may have to reevaluate how you reach your data structure goals.
Conclusion
Six Sigma is all about data. In a services and transactional environment, most data systems aren’t built to support Six Sigma data collection and analysis. This is why automated integration software systems like Hertzler’s GainSeeker Suite can form the backbone of a Six Sigma measurement system, and can create an important link between the business and legacy information systems. The best approach is to use these systems with a complete grasp of the process, an intimate knowledge of the legacy information systems, thoughtful operational definitions of the process and careful consideration of the critical inputs (Xs) that drive the desired outcomes (Ys).
About Hertzler Systems
Hertzler Systems provides seamless, accurate data acquisition solutions that drive business transformation. They have been in this business for over 20 years, with a diverse customer base in service, transactional and manufacturing environments. Their software and services enable clients to connect, collect and analyze data; building a robust data infrastructure for making data-driven decisions. These capabilities help clients to reduce costs, cycle time and errors, and increase profitability. Hertzler’s clients include BAE Systems, Crown Audio, IDEX Corporation, McCormick & Company, Inc., Hormel Foods Corporation, and Titleist & Footjoy Worldwide, just to name a few.
![]() Open this as a PDF in a new window
Open this as a PDF in a new window
