Here are two contradictory perspectives on OEE (Overall Equipment Effectiveness):
“Often, the returns from overall equipment effectiveness (OEE) forays that improve asset utilization or statistical process control (SPC) initiatives that limit process drift pay for themselves within a year — if not sooner depending on the accessibility of the data.” 1
“OEE is a potentially dangerous KPI for a manufacturing company to rely on for business decisions and operations management.” 2
The OEE (Overall Equipment Effectiveness) metric has fallen in and out of favor in manufacturing circles over recent years. Beyond the poles of hype and critique, is it possible to navigate a third, thoughtful path that uses the OEE metric to drive business transformation?
OEE Defined
Overall Equipment Effectiveness is a measure of manufacturing performance. At the most fundamental level, we apply OEE to a single asset (machine or piece of equipment). We must take care when we roll up OEE values across multiple machines, lines, or facilities.
OEE is made up of three component measurements: Availability, Performance, and Quality.
Availability, or up time, is the percentage of the scheduled time that a machine is able to operate. The formula is:
Availability = (Available time – Down Time) / Available Time
Performance describes the speed that the equipment is running at, relative to its target speed. The formula is :
Performance = Total count of parts produced / Expected Count
Quality is the ratio of good units compared to all the units that were started. Sometimes Quality is called First Pass Yield:
Quality = Good count / Total count
Each of these three component measures is presented as a ratio, so each is multiplied by 100 and reported as a percentage.
To calculate OEE, simply multiply all three ratios together:
OEE = Availability * Performance * Quality
The Hype
In the early days, OEE was presented as a single “creative and proven solution 3” that would
- Reduce downtime costs
- Reduce repair costs
- Increase labor efficiency
- Reduce quality costs
- Increase personnel productivity
- Increase production capacity
With these kinds of promises who wouldn’t want to implement OEE? And who wouldn’t be skeptical?
The vision of the OEE metric seems to be something that a plant manager can look at “when they’ve been out of the office for a bit and want to know how things are going. They don’t want an hour-long briefing. They want a single metric, which tells them whether they can relax or begin drilling down to try to understand what went wrong. “ 4
The critique
OEE as the holy grail for KPIs (Key Performance Indicators) can’t possibly live up to the hype. It’s too much responsibility for a single metric. And these criticisms are not without merit.
For one thing, multiplying three ratios together to get a fourth value is going to hide some things. The final number (OEE) will, by definition, lack sensitivity. A shift of one of the component values may completely mask a shift in the opposite direction by another component value.
Also, OEE can’t be viewed in isolation. OEE doesn’t say anything explicitly about profitability. Nor is it a direct measure of customer satisfaction. Narrowing your world to OEE alone is like putting on blinders. You’ll have good focus, but you may miss some very important signals.
Finally, OEE is difficult to compare across assets and across facilities. Each asset has its own baseline for performance, and if you fail to consider that in your rolled up OEE numbers you’ll likely end up comparing apples to automobiles.
What’s needed
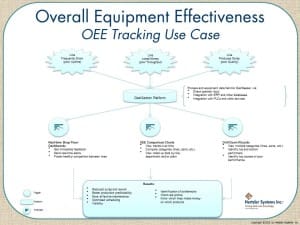
 What’s needed is thoughtful application of the OEE principles, along with tools that allow users to maximize the value of OEE metrics. The GainSeeker Suite OEE Use Case illustrates this thoughtful application.
The GainSeeker platform aggregates OEE data from a variety of sources. These include direct operator input, integration with ERP and other business systems, and integration with machines and devices. These integration points insure consistency in the quality of the aggregated data over time, and minimize the costs of capturing and managing that data.
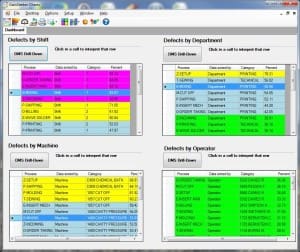
Once the data are aggregated, GainSeeker provides real-time shop floor dashboards and real-time alerts to notify key stakeholders when something changes at the level of an individual asset.
OEE Comparison charts enable users to track asset performance over time. Unlike many point solutions where data is retained for brief periods, GainSeeker gives you a clear perspective of performance over days, weeks, or months. You can roll the data up by line, department, or even plant.
Critics point out that rolled up data can mask natural baseline differences in equipment, materials, and products. 5 While this is certainly valid, an easy-to-use drill down capability into that data can more than compensate, and actually drive additional value.
Automated drill down wizards make it easy to identify various components of the system, and to track their performance over time. Furthermore, the capacity to track multiple variables (by product and by machine, for example) makes it easy to align and optimize the performance of the whole system.
Deliverables
GainSeeker Suite provides a wide variety of user-configurable OEE dashboards and analytical tools. Here are some examples of these tools.
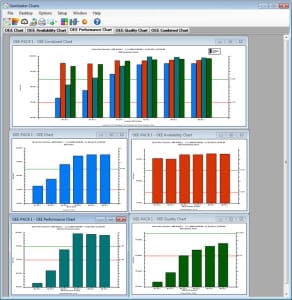
OEE Combined Chart (top) saved on a GainSeeker desktop with individual charts for each OEE metric. You can assign a color for each Metric that carries over to the OEE Combined chart. Notice how easy it is to see the top level OEE values over time, and individual component parts of OEE over time.
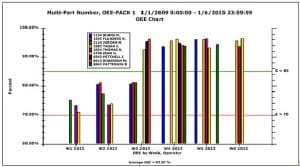
Drill down into OEE data to get proactive quicker using second-level data grouping. This bar chart shows data for operators grouped by week.

Big data widget monitors performance over time, and summarizes opportunities with color coded information.
GainSeeker’s Big Data Analytics Dashboard widgets can also be saved together with other dashboards on a desktop.
Results
Applied thoughtfully across an organization, OEE can help drive
- Reduced scrap and rework
- Better production predictability
- More effective maintenance
- Optimized scheduling
- Visibility
- Identification of bottlenecks
- Improved uptime
- Know which lines make money on which products
This in turn will help you increase revenue through improved customer satisfaction and increased operational capacity, grow operating margins through reduced material costs, reduced non-value added activity, and increased value-added activities, and improve asset levels by improving inventory turns.
Download my free ebook, Tripping Over Data, for a useful guide to understanding the business impact of suboptimized data systems.
1 “Helping Manufacturers Move Beyond Visibility to Advanced Analytics,” Simon F Jacobson, Gartner, 17 March 2015, Publication G00275631.
2 “The Dangers of OEE as KPI for Manufacturing Operations Management.” Manufacturing Operations Management blog. (Accessed 6/24/2015.)
3 “Manager’s Guide to Overall Equipment Effectiveness.” Modern Machine Shop. (Accessed 6/24/2015.)
4 “Is OEE An Effective Metric for Assessing Industrial Production?” RP Siegel October 14, 2013. ThomasNet (Accessed 6/24/2015.)
5 “Is OEE a Useful Key Performance Indicator?” Jeffrey Liker. IndustryWeek. (Accessed 6/24/2015.)
“Criticisms of the OEE Metric…in 140 Characters or Less.” Mike Roberts. LNS Research. (Accessed 6/24/2015.)


