I came up with the Data Cost / Value Matrix to help me explain what organizations can do to become more Data Driven.
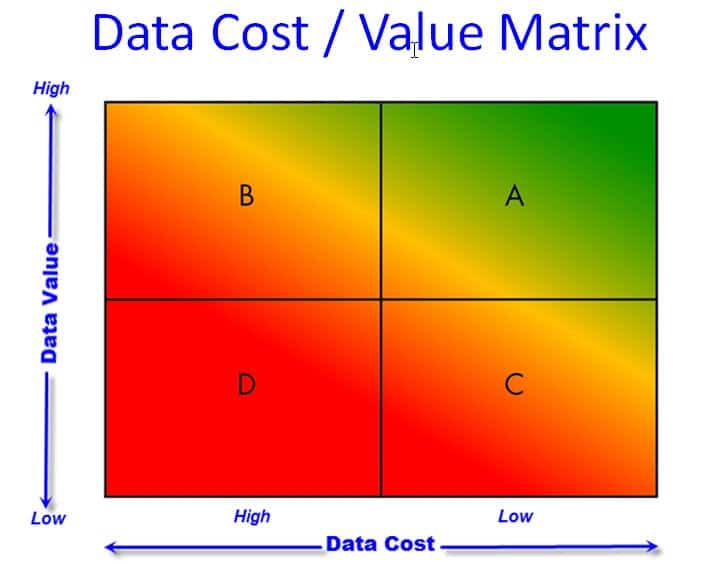
On the horizontal axis we have cost of data, going from High to Low. On the vertical axis we have the value of data, going from Low to High. The Data Driven Organization lives in the upper-right quadrant, where data is inexpensive and of high value.
Unfortunately, the Data Driven Organization is in sharp contrast to most businesses. Many business leaders dont realize that they can have it both ways: high value data at low cost. While there may be an infinite number of ways companies fall short of being data driven, our experience is that they fall into three broad camps. I’ve seen these companies, and maybe you have too.
Some gain high value from their data, but pay way too much for the knowledge. They’re in Quadrant B on the Cost / Value Matrix. This is typical of many Six Sigma companies. Six Sigma companies, for the most part, understand listening to the Voice of the Process better than many other organizations. They apply proven, disciplined techniques of project management and statistical problem solving to get to the bottom of chronic, entrenched problems. Payback from these programs is huge.
However, many Six Sigma Black Belts spend an inordinate amount of time scrubbing and massaging data in order to get something useful. We call this effort the Six Sigma Data Shuffle.
Oddly this pattern is seen as normal in the Six Sigma world. If somebody in your organization has to copy files from one folder to another, reorganize the data in some new format (convert from .csv to .xls) and then scrub the data so that all descriptive fields match (make McConnell, F. and Frank McConnell into F. McConnell), all before you copy it into MINITAB where you have to group it in into appropriate samples and manually enter specifications before you can begin to analyze the data, then you are paying too high a price for clean data. See our white paper Freeing Six Sigma from the Data Shuffle for more on this topic.
Others (Quadrant C) pursue data for datas sake. They build elaborate data collection systems that effectively protect the user from their customer, but provide little or no additional value to the business. An example of this is an automotive supplier who told me If the customer calls with a complaint, Ill print out a blast of several thousand data points and email or fax it to him. He gets real quiet when he discovers I have the data. The fact that this data is rarely used to make improvements to the process (and eliminating the customers complaint) doesnt seem to concern this manager.
A third camp (Quadrant D) has the worst of both worlds: they pay a high price for data, but have almost nothing to show for their efforts. This is typical of mature organizations with a long tradition of inspecting quality into a product. These businesses may have enormous file cabinets full of hand written data sheets. Data are written on an inspection sheet and then filed away. Getting to the data is a laborious process requiring the patience of Job and the dogged determination of Wiley Coyote.
In a future post I’ll share a quick test that you can take to determine just how Data Driven your company is. In the meantime, what’s your best quess? Which quadrant does your business live in? Use the ShareThis button below to mark this page, leave a comment, tweet me, schedule a conversation, or call 800-958-2709.
One Comment
Comments are closed.

[…] The Data Heads « Data driven – NOT … […]