Last month I highlighted the SPC Variation Wizard in the GainSeeker Charts module. GainSeeker’s Defect Management System (DMS) incorporates a wizard as well. Welcome to the Drill-Down Wizard for defect data!
The Pareto Chart
The definition of a Pareto chart is “a type of chart that contains both bars and a line graph, where individual values are represented in descending order by bars, and the cumulative total is represented by the line.” In other words a Pareto chart typically displays the lists of defects with the highest category at the top.
One of really powerful features of GainSeeker Pareto Charts is that it is really easy to drill into any bar on the chart to see what makes up that bar of the Pareto Chart. So you might start with a Pareto Chart of Defects, and then drill into the top bar to find out which machine or operator or material lot number had the most of that type of defect. GainSeeker makes it easy to drill down multiple times on the same chart.
The Drill-Down Wizard for Defect Data automates that drill down process.
Once a Pareto chart opens in the GainSeeker Charts module, you simply right-click to access the “Start drill-down Wizard” option. Similar to the SPC Variation Wizard, the drill-down wizard has a possibility of three steps for you to go through.
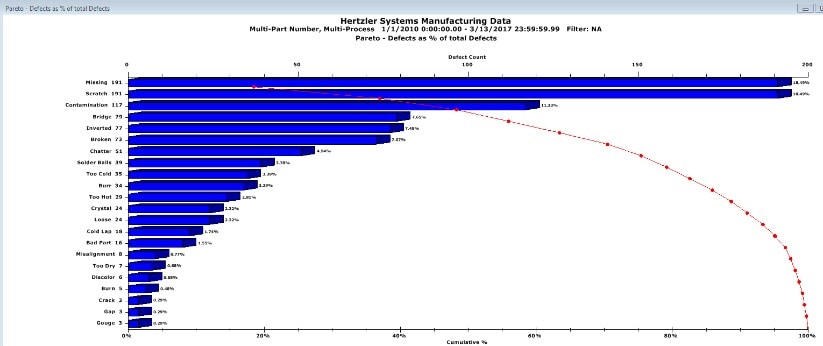
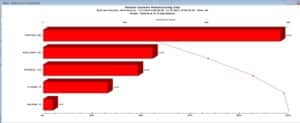
GainSeeker Suite Pareto Chart
Let’s take the example below and go through the wizard together:
The Drill-Down Wizard
- Right-click on the Pareto chart and select the drill-down wizard.
- Step 1 menu displays: You can select or deselect the traceability values used in the analysis. There are also other options on this menu you can set as well such as:
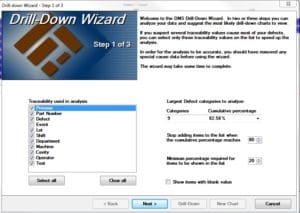
GainSeeker Suite Drill-Down Wizard for Defects
- Stop adding items to the list when the cumulative percentage reaches X.
- The minimum percentage required for items to be shown in the list.
- Click Next after verifying your options. In this example I left everything defaulted.
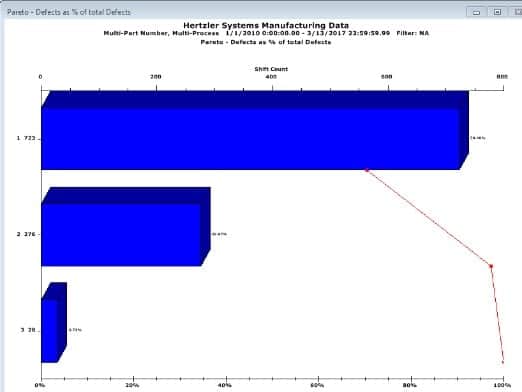
- Step 2 displays the drill-down results of the selected traceability values for your data set. The results appear sorted according to the percentage of defects found for the traceability and category shown on the screen. In our example Shift 1 has 73.97% of the defects.
- On this menu I clicked on the New Chart button. The new chart on the right displays how many defects created by each shift.
GainSeeker Suite Drill-Down Wizard Pareto Chart by Shift

I believe one of the best time saving features is the ability to go back to the original Pareto chart and right-click and chose “resume drill-down wizard”.
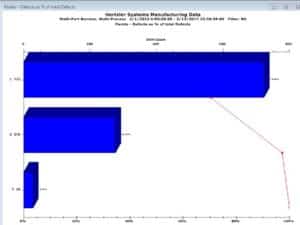
- For this example, I clicked on resume drill-down wizard and clicked on Next. This brings us to Step 3 which displays the drill-down results for data where shift = 1. I highlighted Department and clicked on New Chart.
GainSeeker Suite Drill-Down Pareto Chart by Department

In this demonstration you quickly see the benefits of being able to look at your Pareto chart in various meaningful ways. I hope this was beneficial for you.
Still have a question? Use our Ask an Expert page. If you do not have GainSeeker yet, I urge you to schedule a demo! Oh, and do not forget to tell them that Jen sent ya.
