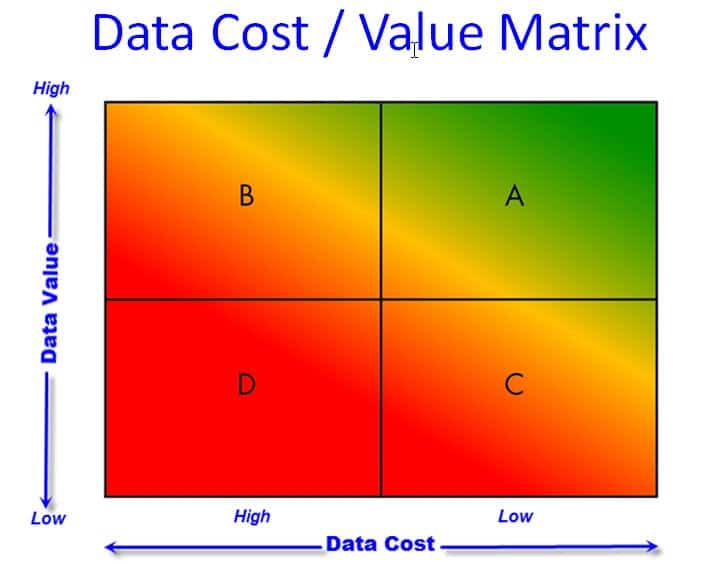
One of the really important aspects of the Data Cost / Value Matrix is how reducing the cost of data can help you get more value from data.
This came up again the other day as we were debriefing following a recent deployment for a new customer. This customer is about to undergo a major cultural transformation because we helped them automate real-time data collection and analysis. In the process, they will shift from a Product Control to a Process Control way of looking at the world. Ultimately this will reduce costs, increase customer satisfaction, and (we hope) drive new business.
This customer makes electronic devices. Their products are complex pieces of equipment, and at a couple places on the production line, the various component parts and the final assembly pass through an automated test stand. This test stand runs the unit though dozens – even hundreds of electrical tests. A unit has to pass all of those tests to be released to their customer.
Sounds like a winner, right? One hundred percent inspection. Nothing bad ever escapes to the end user. And we have the data to prove it. Boy, do we have data. Entire databases of rows and columns of numbers. Every one of them in spec.
Except it doesn’t work that way. Some units pass all the tests with flying colors – and then fail out of the box or early in the life of the product. Here is what the data for one test parameter looks like plotted on a histogram (this isn’t actually the customer’s data – it’s just representative):

In this example, everything is well within spec – it should all be good.
When you look at this data in time series on a control chart it looks very different:

Viewed this way, this data tells a completely different story. If you look closely you can see a couple of signals that the process is unstable, even though everything meets spec. In a complex environment with dozens of critical – and interconnected – variables, these unstable values often directly correlate to the early life and out of the box failures.
Learning to rely on the control chart is the shift from Product Control to Process Control. It is often a tough shift to make – especially when everything is in spec.
What makes it even harder, however, is the sheer volume of data they need to sift through to find those signals. Hundreds of test parameters, hundreds of units tested every day. Automation is the only way you can keep up with the data. By automating the data collection and analysis process you can empower people to make that cultural change.
What about you? How can reducing data costs make it easier to get more value from your data? Use the ShareThis button below to mark this page, or leave a comment, tweet me, schedule a conversation, or call 800-958-2709.
One Comment
Comments are closed.

[…] course if you need data, and everyone is too busy, the best solution might be to automate the whole process. But for a variety of reasons automation may not be possible or desirable. We’re talking here […]