Executive Overview
While you’d have to travel a long way to find a business leader who would argue against the need to create a data driven organization, if you put a dozen leaders in a room you’d probably end up with nearly a dozen definitions of the “data driven organization.” Lacking a common understanding of the data driven organization, leaders sometimes accept as status quo something less than a true data driven organization. They accept something less than their entitlement.
This white paper proposes a common definition of the data driven organization. It also proposes a model for evaluating how effective AND efficient your organization is in using data.
This paper focuses on data for business process management and continuous improvement in a manufacturing environment. It does not attempt to address all applications of data (such as product design, market analysis, and so forth). Nor does it directly address service and transactional data applications. These concepts apply in those environments, even if the specific techniques differ.
Envisioning the Data Driven Organization
I often talk to people who say “Data is not the problem. I have tons of data. But I have no knowledge.”
Imagine an organization where this is the norm:
“We always know exactly what is happening in our organization. We have up-to-the-minute knowledge because I get warnings of trends and anomalies in real-time. At the same time, I don’t have to wade through a lot of noise; only the significant issues rise to the top. Summary information is easy to understand, and supporting details are available instantly. We know where to focus our precious resources to get the best results. We pay almost nothing for the data that gives us this knowledge.”
Knowledge is power. Would your organization have more power if it had more knowledge?
The Data Driven Organization has the right data, in the right form, and it has it right now. Moreover, the data costs nothing.
Getting the right data in the right form
All process improvement methodologies use some form of the Input > Process > Outcome model. Here is the basic model:

What you do with the data you collect makes all the difference in the world.
Many manufacturing organizations use a loop that looks like the figure below.
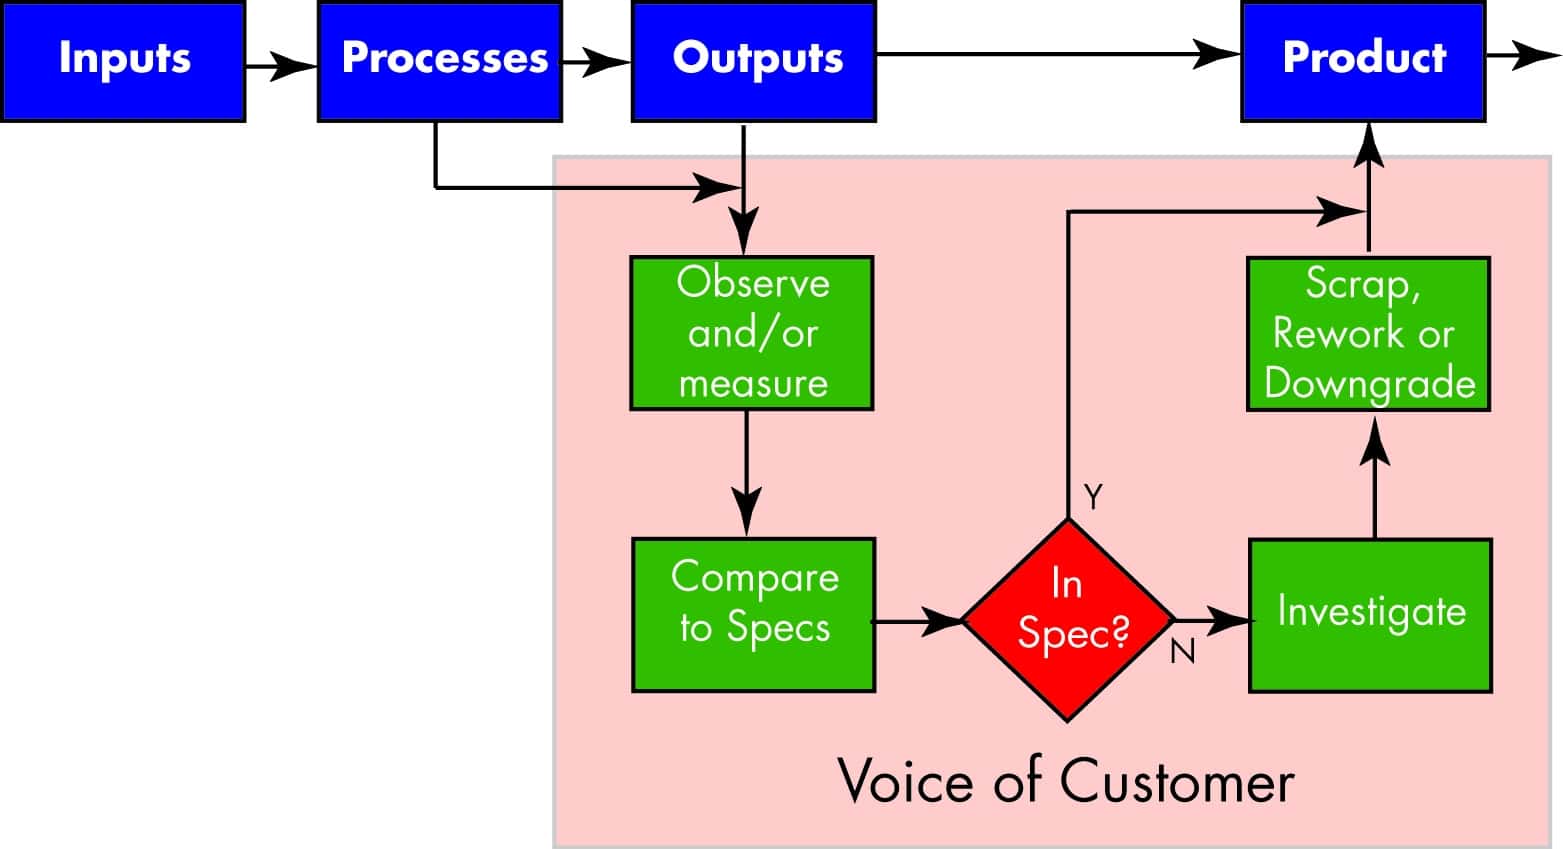
They measure an output and then compare that to the specifications for the process. (Don’t be distracted by the word ‘specs’. This is not limited to a dimension on a manufactured part. For example, it may refer to any measurable requirement such as the number of minutes it takes to close a call in a call center.)
When the observation is compared to a requirement it either meets the requirement or it doesn’t. In either case, the most we can do is investigate problems, then scrap, rework or downgrade the product.
When an organization uses data in this way, they may think they are data driven, and in a way they are. But they have fallen far short of their entitlement.
If you take the same data and make one very subtle change to how you use it, you can make a tremendous stride forward in becoming data driven.
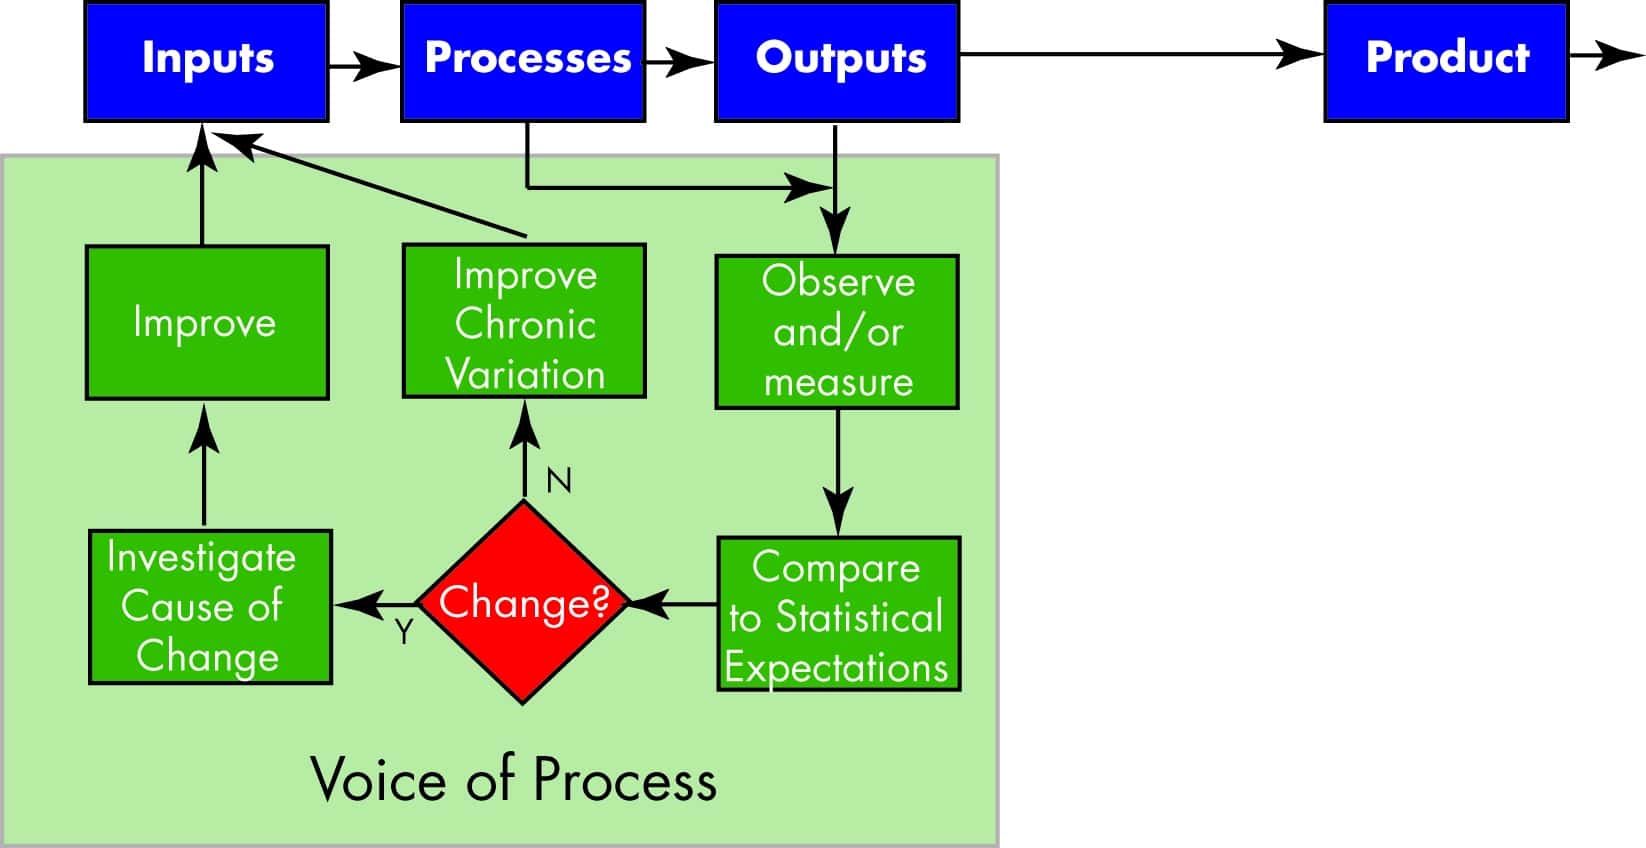
In this model, you start at the same point: you measure an output. But the subtle difference is that instead of comparing it to the specification (the requirement), you compare it to what is expected based on some simple statistical techniques. Now instead of rejecting a product based on the failure to meet requirements, you focus on how you can use the data you’ve acquired to improve the overall process. This is called listening to the voice of the process.
Now you close the loop, but in a different direction. If you find the PROCESS has changed, then you investigate the reason for the change and improve the process. If the process hasn’t changed, then you can evaluate whether you are satisfied with the process output and improve it by finding ways to reduce chronic variation.
This is how you increase the value of data. This is your entitlement.
Three alternatives to the Data Driven Organization
The Data Driven Organization is in sharp contrast to most businesses. Many business leaders don’t realize that they can have it both ways: high value data at low cost. While there may be an infinite number of ways companies fall short of being data driven, our experience is that they fall into three broad camps.
Some gain high value from their data, but pay way too much for the knowledge. This is typical of many Six Sigma companies. Six Sigma companies, for the most part, understand listening to the Voice of the Process better than many other organizations. They apply proven, disciplined techniques of project management and statistical problem solving to get to the bottom of chronic, entrenched problems. Payback from these programs is huge.
However, many Six Sigma Black Belts spend an inordinate amount of time scrubbing and massaging data in order to get something useful. We call this effort the Six Sigma Data Shuffle.
Oddly this pattern is seen as normal in the Six Sigma world. If somebody in your organization has to copy files from one folder to another, reorganize the data in some new format (convert from .csv to .xls) and then scrub the data so that all descriptive fields match (make McConnell, F. and Frank McConnell into F. McConnell), all before you copy it into MINITAB where you have to group it in into appropriate samples and manually enter specifications before you can begin to analyze the data, then you are paying too high a price for clean data. See our white paper “Freeing Six Sigma from the Data Shuffle” for more on this topic.
Others pursue data for data’s sake, building elaborate data collection systems that effectively protect the user from their customer, but provide little or no additional value to the business. An example of this is an automotive supplier who told me “If the customer calls with a complaint, I’ll print out a blast of several thousand data points and email or fax it to him. He gets real quiet when he discovers I have the data.” The fact that this data is rarely used to make improvements to the process (and perhaps eliminating the customer’s complaint) doesn’t seem to concern this manager.
A third camp has the worst of both worlds: they pay a high price for data, but have almost nothing to show for their efforts. This is typical of mature organizations with a long tradition of inspecting quality into a product. These businesses may have enormous file cabinets full of hand written data sheets. Data are written on an inspection sheet and then filed away. Getting to the data is a laborious process requiring the patience of Job and the dogged determination of Wiley Coyote.
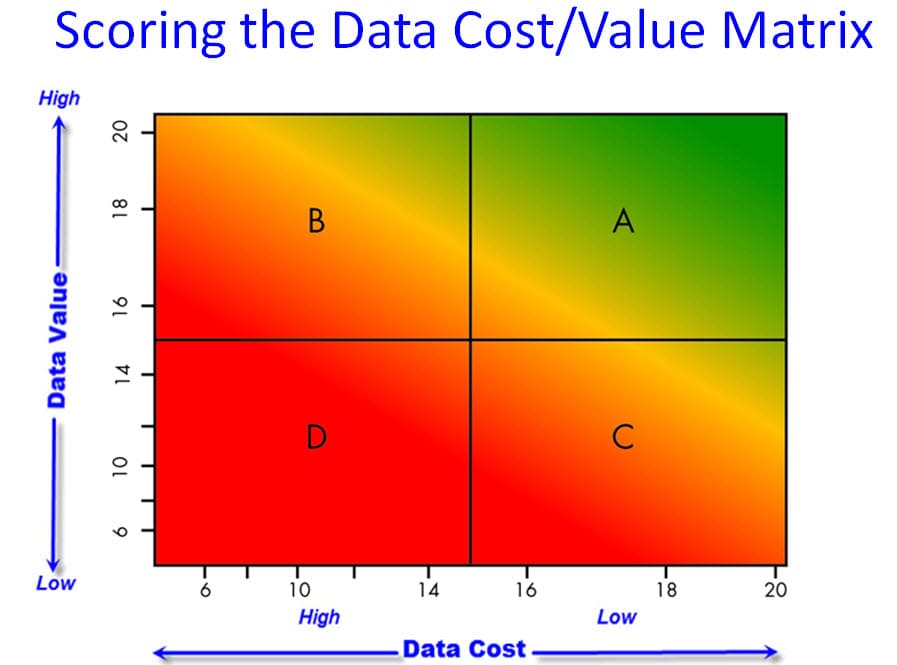
The Data Cost vs. Data Value Matrix
The Data Driven Organization has the right data, in the right form, and it has it right now. Moreover, the data cost nothing. This can best be illustrated with the Data Cost/Value Matrix.
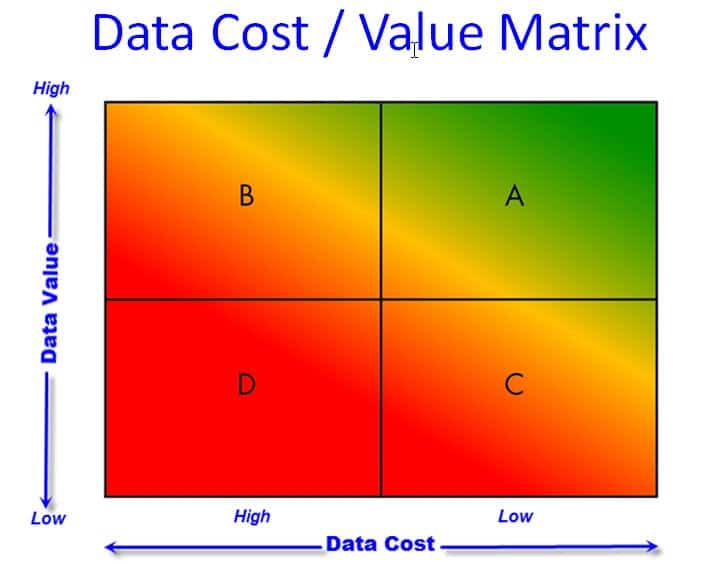
The Data Driven organization is one that functions in the upper right quadrant (A) in the Data Cost/Value Matrix.
The Six Sigma company described above operates in the upper left quadrant (B). They’re using data effectively and gaining a high level of value from it. But the cost of the data is high and the effort required to capture and manage the data typically creates a significant drag on their process improvement efforts.
The quality manager who blasts his customer with thousands of data points is operating in the lower right quadrant (C). He has lots of data and uses it to placate his customer, but is content with results far below what he should accept.
While it seems crazy that a company would operate in the lower left quadrant (D), it is all too common. It happens when the quality program consists of protecting the customer from our problems.
Evaluating your Gap to Entitlement
Here is a simple interactive test you can take (Note: you will need Adobe Flash Player installed) to determine your Gap to Entitlement to the Data Driven Organization. This test looks at four aspects of the value we derive from using data, and four aspects of the cost of that data. You can take this test by yourself, or you can invite key stakeholders – people in the know in your company and even your customers – to rank your business.
Four Aspects of Data Value
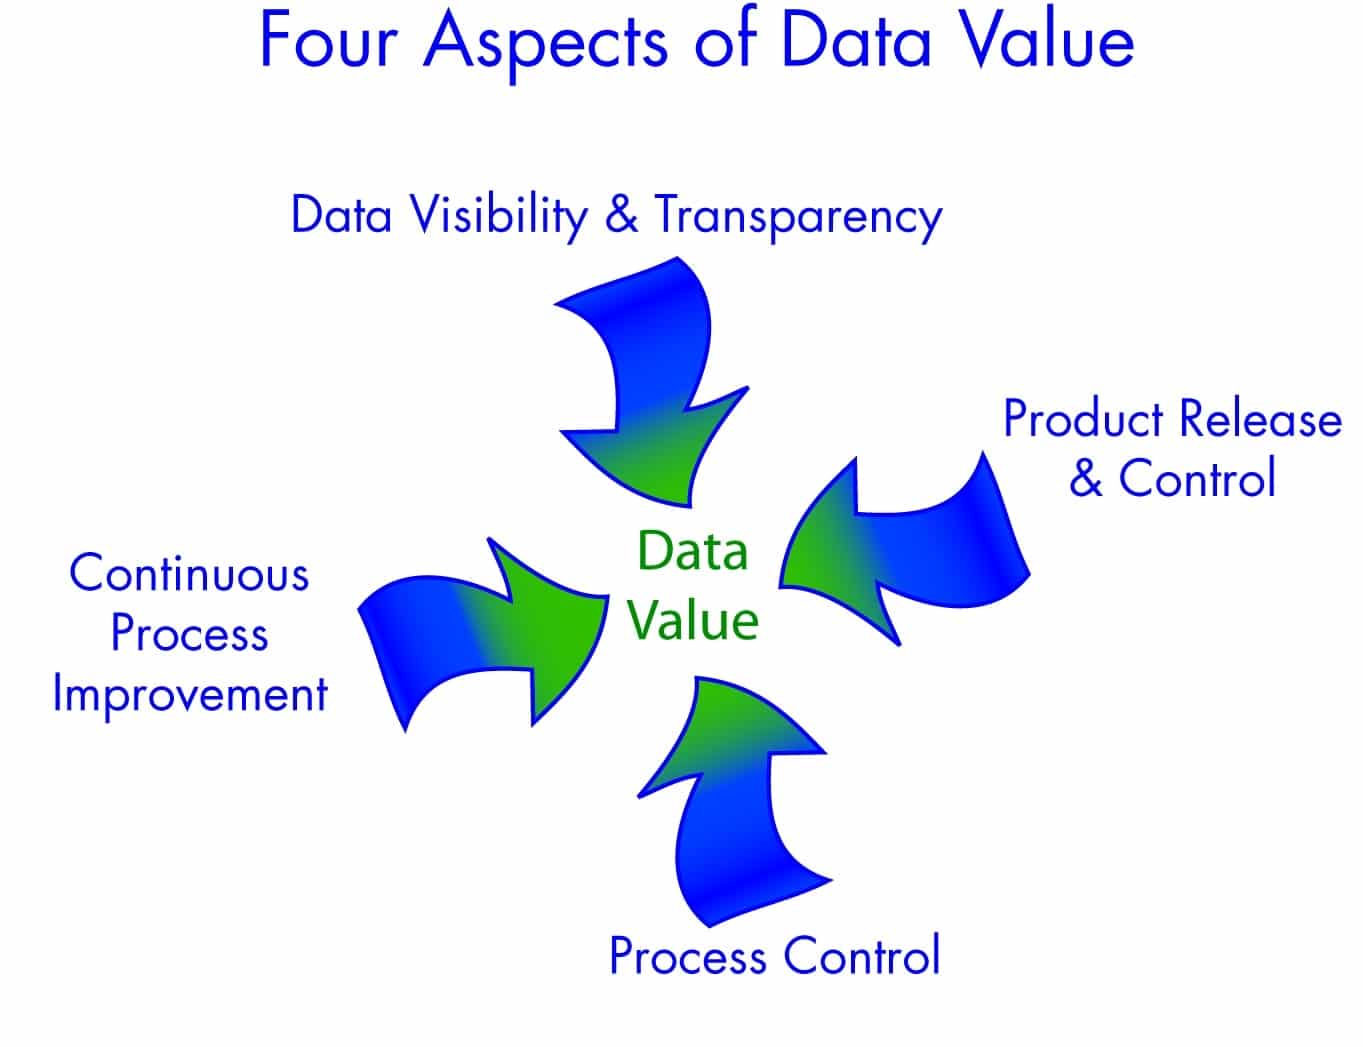 In a manufacturing environment, there are four aspects of the value we get from using data.
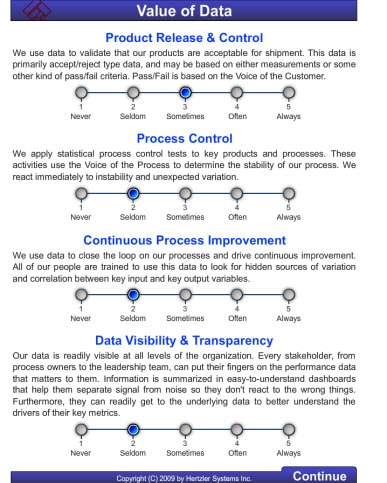
Product Release & Control
We use data to validate that our products are acceptable for shipment. This data is primarily accept/reject type data, and may be based on either measurements or some other kind of pass/fail criteria, and is based on the voice of the customer.
Process Control
We apply statistical process control tests to key products and processes. These activities use the Voice of the Process to determine the stability of our process. We react immediately to instability and unexpected variation.
Continuous Process Improvement
We use data to close the loop on our processes and drive continuous improvement. All of our people are trained to use this data to look for hidden sources of variation and correlation between key input and key output variables.
Data Visibility & Transparency
Our data is readily visible at all levels of the organization. Every stakeholder, from process owners to the leadership team, can put their fingers on the performance data that matters to them. Information is summarized in easy-to-understand dashboards that help them separate signal from noise so they don’t react to the wrong things. Furthermore, they can readily get to the underlying data to better understand the drivers of their key metrics.
Now score your organization on each of these four aspects.
My company routinely demonstrates best practices in these areas:
| 1 Strongly Disagree |
2 Disagree |
3 Neutral |
4 Agree |
5 Strongly Agree” |
|
|---|---|---|---|---|---|
| Product Release & Control | |||||
| Process Control | |||||
| Continuous Improvement | |||||
| Data Visibility |
Scoring the value your organization gets from data
Add up the scores at the top of the table for each question. For example, if you said you Strongly Agree that your organization routinely demonstrates best practices in Product Release & Control, give yourself 5 on that aspect. If you rate your organization as Neutral on, say, Data Visibility, give yourself a 3 for that aspect. Add up the four scores to get your total Data Value Score.
Four Aspects of Data Costs
Likewise, the cost of data in a manufacturing facility can be evaluated against four criteria.
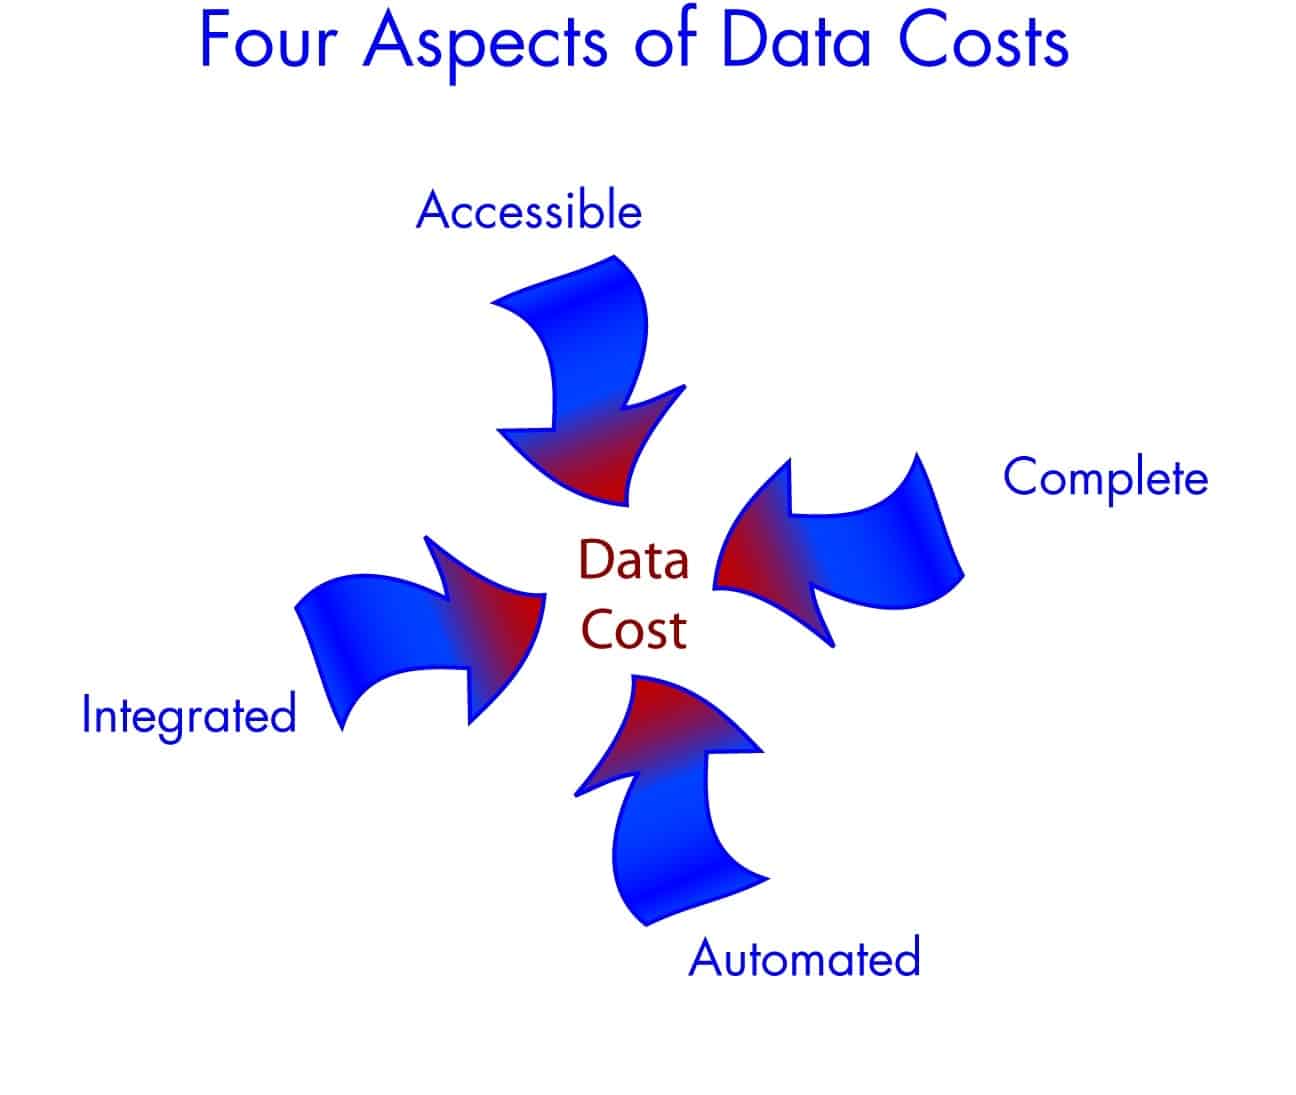
Complete
We collected all the data we need, and no more than is necessary.
Automated
We write down very little data. In fact, we type very little data into computer systems. We use bar codes, RFID or other identification technologies. We capture data from digital equipment whenever possible. Wherever possible we have eliminated human interaction with data collection, and we are confident through data driven statistically valid measurement system analysis that the data are reliable.
Integrated
We have specialized data systems to run various aspects of our business, but we don’t have silos of data that are used for only one purpose when the data can be useful to other applications. Put another way, data is never entered more than one time anywhere in our business.
Accessible
Anyone can get to the data they need at any time. We don’t have to rely on specialists to write special queries or export data. We’ve learned that our people do not need to be programmers to make good use of data.
My company routinely demonstrates best practices in these areas:
| 1 Strongly Disagree |
2 Disagree |
3 Neutral |
4 Agree |
5 Strongly Agree” |
|
|---|---|---|---|---|---|
| Complete | |||||
| Automated | |||||
| Integrated | |||||
| Accessible |
Scoring the cost of your data
Just as you did for Data Value, add up your four scores for Data Costs, add up your scores for the four aspects of data costs. This will give you a total score for Data Value and a total score for Data Costs.
Plot your coordinates on the matrix.
Closing the Gap to Entitlement
If your company’s entitlement is high value data at little or no cost, and there is a gap between your current performance and your entitlement, you can take corrective action to close the gap. The action you take depends on where your company falls on the matrix.
If you are in Quadrant B, you can gain tremendous leverage by looking for ways to automate data collection and data validation. This is especially critical in the Control Phase of Six Sigma projects where your highly compensated black belts need to be able to leave an easy-to-use data system in place that gives accurate, timely feedback to process owners. This frees them to pursue new projects (without getting pulled back to collect and manage data on old projects) and at the same time helps to ensure that the gains realized from the project are sustained. Sustaining the gains continues to be one of the most significant challenges in Six Sigma.
In addition, look for ways to summarize data using dashboards and rolled up data views so that business leaders can get a high level perspective on performance and still drill into the details when needed.
If you are in Quadrant C, the good news is that you already have data. However you face significant challenges because moving to Quadrant A requires a hard look at leadership and your culture. You will probably need to pay attention to a whole new set of issues. For starters, here are some questions you might ask yourself:
- Is our management team committed to continuous improvement?
- Where are we hurting? Why do we need to change the status quo?
- Are we paying attention to the right metrics?
- Have we eliminated non-value-added activities in our processes?
- Are our processes mapped and well understood?
- Have we performed MSA on the data collection systems that are being used?
- Do we effectively use FMEA to identify risks in our processes?
- Is our staff equipped with the knowledge of the tools and techniques of continuous improvement?
- Where do we close the loop on improvement? Is it in response to individual problems ‘after the fact’, or is early in the process based on trends and signals from within the process?
Companies in Quadrant D have the greatest challenge. The good news, however, is that you don’t have to follow a path though Quadrants C and B. You can attend to both cost and value and avoid the mistakes of focusing on one at the exclusion of the other.
Maintaining a dual focus is not as difficult as it sounds. The trick is to provide low cost, accurate, reliable data, and at the same time use the data to monitor the PROCESS, not the PRODUCT.
Conclusion
Business leaders in data driven organizations always know exactly what is happening inside their company. They have up-to-the-minute knowledge of trends and anomalies. Only significant issues rise to the top, so they don’t have to wade through a lot of noise to spot the significant issues. Those rise to the top. Summary information is easy to understand, and supporting details are available instantly. These people know where to focus their precious resources to get the best results. And best of all, they pay almost nothing for the data that gives them this knowledge.
These business leaders have the right data, in the right form, at the right price, and they have it right now.
About the author
Evan Miller is President and co-owner of Hertzler Systems Inc., having purchased the company in 1992 with his business partner, Byron Shetler, from founder Paul W. Hertzler. Mr. Hertzler retired in 1993 and passed away in 1994.
Hertzler Systems provides seamless, accurate data acquisition solutions that drive business transformation. They have been in this business for over 25 years, with a diverse customer base in service, transactional, and manufacturing environments. Their software and services enable clients to connect, collect, and analyze data; building a robust data infrastructure for making data-driven decisions. These capabilities help clients to reduce costs, cycle time and errors, and increase profitability. Hertzler’s clients include Hormel Foods, BAE Systems, IDEX Corporation, McCormick & Company, Inc., Pactiv Corporation, and Titleist & Footjoy Worldwide, just to name a few.
![]() Open this document as a pdf in a new window
Open this document as a pdf in a new window
