How to put your best people on tasks that really matter, instead of massaging, scrubbing, and manipulating data from here until next Sunday
By Evan J. Miller
“I had these two high-powered and highly compensated engineers – really two of my best people – spending hours scrubbing data and building databases to get the information they needed for their projects.” —Jeff Holman, President, Micropump.
This quote from the President of a Lean Six Sigma manufacturing company captures the essence of the problem addressed by this paper. In short, the Six Sigma community puts up with an amazing amount of busy work in order to become data driven. As another executive described it to me: “It’s the every day junk work that we do that we call our jobs.” The roots of this situation are deep within Six Sigma itself: Black Belts are brought into training, assigned to a project and told to go start measuring something. They probably aren’t IT people, but they’re smart, resourceful and, need I add, driven. They’re going to get some data.
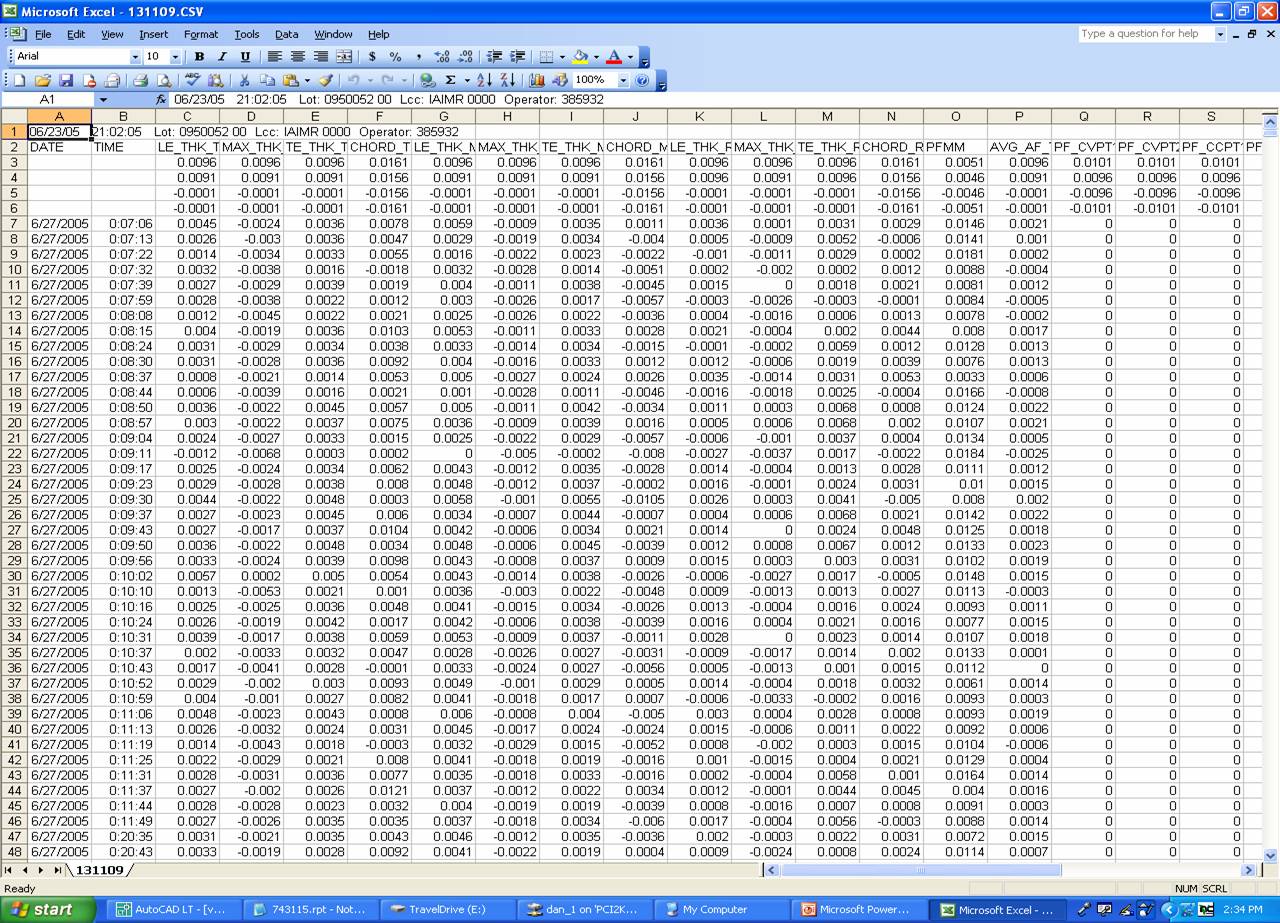
What will they do to get data? Let’s look at a couple of typical examples, both from manufacturing firms intent on capturing and distilling rich streams of data. The first situation comes from a CMM. Figure A shows a data source, viewed in Excel. This data format – rows and columns – is common across many industries and many applications. Most data dumped from a database ends up looking something like this – whether it is manufacturing or transactional data.
Each row represents a part that is inspected; each column a dimension or reading. This kind of data is very common. A customer recently sent this to me as an example of what he has to do every day that is his “junk work he does every day that he calls his job.” It took 24 PowerPoint slides to document this activity, which includes 43 discrete steps, including two loops one of 7 steps and one of 19 steps.
The time this takes is substantial. Even if you are tracking only 20 variables, you quickly run up 20 or 25 minutes to capture data for each part number.
If your company is producing a dozen products at a time, it doesn’t take long until you have somebody spending most of their time preparing reports. The note at the end of this training material describes the motivaton for all this work: “NOTE: THE WEEKLY FILES FOLDER WAS GENERATED SO THAT IF A MANAGER OR CELL LEADER WANTED TO REVIEW A PART NO. OR LIST OF PARTNO,. HE OR SHE COULD EASILY ACCESS THE DATA.” Isn’t this a lot of work just in case a manager wanted to review a part?
Another typical application comes from the electronics industry, but the same principles apply in other examples – web traffic analysis for example. This situation creates an even greater data management burden. That’s because data are in successive rows, not in nice neat columns. Figure B shows a typical example:
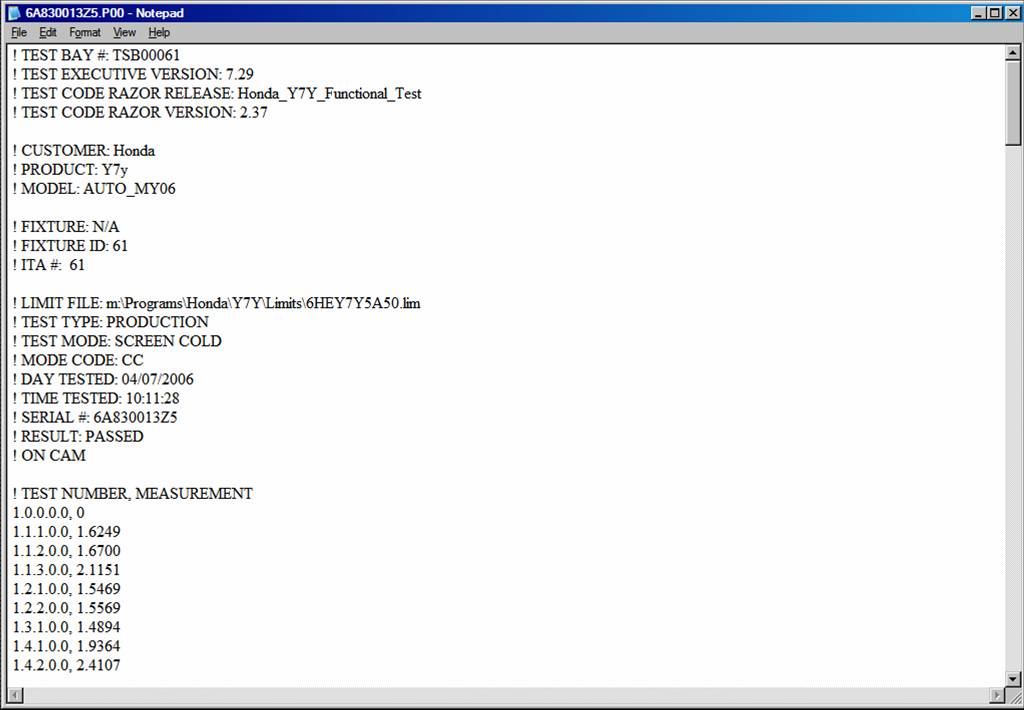
The file starts with a bunch of header information, and then has specific test results. 1.1.1.0.0 is one test, and the result is 1.6919. There may be hundreds of rows in this file, and each row is one test.
One of my customers had a problem with out-of-the-box failures with units that passed Final Test, but failed when the customer opened the box. What happened? Did something change in transit? Whose test was right – the supplier or the customer?
After agonizing over this for years, a bright black belt asked for 7 or 8 days of data – one day for each unit that had failed at the customer site. She narrowed down her search to a couple of suspected key Xs for each defect reason and discovered that although the test result for a given serial number was within specification, its difference from the other units test on the same parameter on the same day was statistically significant. In other words: if we let the process speak (instead of artificial engineering limits), it will tell us when we have a defective unit!
But look what we have to do to capture this data: Open a text file. Record the time the sample was taken. Scroll down or search for the first parameter. Copy and Paste or (probably faster) type the value into a spreadsheet or Minitab. Repeat the search, copy and paste for all the suspected Xs in the file. Repeat with 30 to 40 of these files. This is too time consuming and too error-prone to do on a daily basis, much less in real-time. Is there any wonder this organization is eager to automate this process?
What’s wrong with this picture?
Recently the Aberdeen Group published “The Lean Six Sigma Benchmark Report”, based on surveys of 400 companies that practice Lean Six Sigma. One of the questions the practitioners were asked was what are the challenges they face. Their responses are summarized. At the top of their list was “Significant culture change required.” (Figure C)
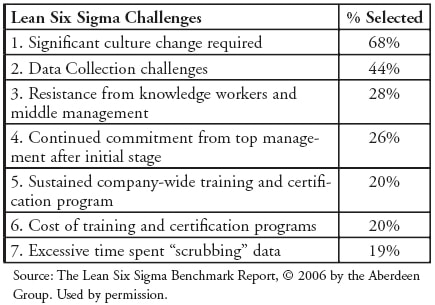
This challenge is followed, distantly, by “Data collection challenges”. “Excessive time sent scubbing data” is at the very bottom of the list. In the middle are several issues that sound like cultural issues: Resistance from middle management and continued leaderhsip commitment. Perhaps these are two specific categories of cultural change.
So cultural change is by far the biggest challenge in implementing Lean Six Sigma. For those who have been around this industry for awhile this is hardly controversial.
What is fascinating is how we have responded to these changes. Figure D lists the strategies that our survey respondents have followed to overcome the cultural barriers.
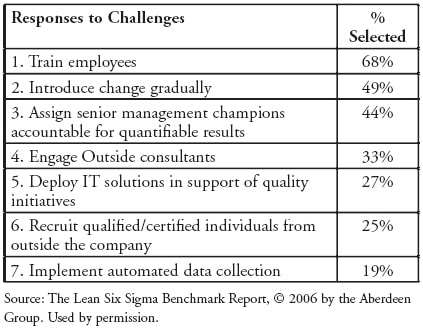
Most of these are unquestionably accepted as the way you change culture: train, train, train, introduce change gradually, hold people accountable, bring in outside consultants, recruit people from outside… These are motherhood and apple pie responses to the cultural change. Has anyone in the Six Sigma world ever been fired for saying the problem is culture and the cure is more training, more consultants, better people?
Lets back up for a minute and ask: What is the culture that we want to create?
Isn’t it a culture where opinions and job title take a back seat to data? Isn’t Six Sigma’s holy grail to become ‘data driven?’ Isn’t it a culture where truth in the form of objective statistical analysis of reliable data trumps personalities and politics?
“Real-time access to accurate, actionable data is the number one tool that has enabled us to move to a data driven culture.”
|
If that is the case, then listen to what Royce Binion, Operations Manager for BAE Systems, Fort Wayne, said to me once: “Real-time access to accurate, actionable data is the number one tool that has enabled us to move to a data driven culture.”
Why is it that IT solutions have only been deployed by 27% of the population and automated data collection by only 19%. Maybe it is time to stop spending so much effort training people and instead give them the data so they can use the training.
Case Study – How one company tackled the problem of actionable data
Remember the president we introduced at the start of this paper? He decided to tackle the problem head on and establish a system for capturing real-time process data from across the company. He set up a team to develop a list of Critical to Quality Characteristics (CTQ’s) for this system. Here are the CTQ’s that they developed:
-
- SPC must be used for process control in manufacturing.
We need the ability to automate data collection and real-time alarms in all of our manufacturing processes. We must use existing quality data collection processes wherever possible. We also need better support for automatic gaging, and more transparent data sharing. And we want our process owners to be able to respond instantly to process shifts or special cause variation.
-
- The ability to accurately track transactional process performance.
We believe that we should be able to track manufacturing and transactional data at the same time, with the same system. While there clearly are differences between transactional and manufacturing data, there are also a lot of similarities. We want a comprehensive system that can live in both worlds.
-
- A way to link information from many databases for use in operations.
We already have a lot of data in various databases. We need a way to bridge these disparate systems.
-
- One source for process and product data.
Once again, regardless of the source of the data, (dimensional, equipment performance, cycle times, defects, product testing), we need a way to reach it.
-
- Mistake-proofing of data
We need to use current technology to eliminate operator data input errors. We need the ability to use barcode scanning, pre-filled data fields, drop-down lists, etc.
-
- Real-time information about all processes.
We already have the taste of how real-time data can help certain operations. We want that shared across all processes.
-
- Ease of use by operators, supervisors, engineers and Black Belts
We already have a system that is cumbersome and difficult to use. We want to make their lives better, not worse.
-
- Compatibility with statistical analysis software.
Our standard for advanced analysis is MINITAB. We need a system that will readily share data with MINITAB. This point is actually a subset of the topic ‘Ease of use.’
-
- Limited resources required for initial set-up and ongoing system maintenance
Finally we need a system that requires minimal on-going IT support and resources. We are stretched too thin to place more demands on the IT staff.
The team then considered several options for meeting the CTQs. Here is their analysis of the options.
-
- Hiring a programmer to create an application that could share information between current scheduling, SPC, engineering drawing and related databases.
| “We didn’t want to be in the business of writing custom software.” |
This held some appeal because we believed our needs were pretty specialized, and because we wanted control of the solution. Initially it seemed like it might be more cost effective, but as we considered our core competencies and our head count we realized that we didn’t want to be in the business of writing custom software. It was hard to justify putting more human resources into the Six Sigma cost equation before we began to see the payback.
The clincher, however, was considering how we would maintain a home-grown system in the future. We had all seen clever, home-grown software solutions implemented to solve specific problems, only to see those systems hamper the organization as they became out-dated and unsupportable.
-
- Dedicating a portion of a Black belt resource to data integrity.
| “Clean data is an enabler, but it doesn’t add value. So dedicating highly valued resources to non-value-added activity was counter-intuitive.” |
We quickly recognized that while having clean, reliable data was absolutely essential to driving Six Sigma projects, the act of getting that data added absolutely no value to our business. Clean data is an enabler, but it doesn’t add value. So dedicating highly valued resources to non-value-added activity was counter-intuitive.
We considered investing in training and developing other people to harvest the data we needed, but the investment costs in lead time and training resources were considerable. And the bottom line was that they still needed some kind of software and hardware to do the job. Clip boards, pencils, stop watches, and mechanical gages were inadequate resources no matter who did the work. Better to find the right systems and then find the best resources to implement those systems.
-
- Investing in an enterprise wide knowledge-management system.
| “Some of the summary reports and airplane-style dashboards were very attractive, but they didn’t solve the core problem: getting clean, reliable data in a cost-effective manner.” |
Enterprise-wide knowledge management systems great summary reporting tools, but they all lacked several key capabilities that were essential to our business.
First, a large portion of our efforts were focused on the manufacturing shop floor. These systems lacked the connections we needed to gages and manufacturing equipment. Coupled with that was a serious weakness in real-time statistical analysis capabilities. While most of these tools could tell us when something missed a target, they couldn’t identify a statistical shift in mean or a statistical trend in real-time. Nor did they readily interface to our statistical analysis software (MINITAB). Finally, they didn’t help us scrub the data. In that way, they really didn’t move us beyond where we already were: spending countless hours massaging and scrubbing data for our projects.
-
- Investigating the capabilities of different SPC software packages
| “Our precious Belt resources now spend their time doing the work of continuous improvement instead of cleaning data or being a shadow IT department.” |
This proved to be the best course of action for us. While these systems have a reputation for belonging on the shop floor, the good ones do that and much more. In short, we were able to find a system that met all of our criteria. That system has been deployed now for nearly four years, and it continues to provide us with clean, reliable data in real time so that we can deploy continuous improvement across the company. Our precious Belt resources now spend their time doing the work of continuous improvement instead of cleaning data or being a shadow IT department.
Conclusion
Organizations that make sure their people have accurate, actionable data available in real-time have more effective and focused Six Sigma programs. For Micropump, projects are scoped, prioritized and chartered faster in the Define phase. In the Measure phase, there is an average 10% reduction in cycle time, and they have an almost painless transition to Control.
![]()
Open this document as a PDF in a new window
