|
Contents [Hide] |
There are several ways to launch the Design Report window where you will design the report:
From the main window in Dynamic Reports 2, select a report and then click the Design button (or click the File menu and select Design).
On the Retrievals for Report window, after selecting one or more retrievals for the report, click Save & Design.
On the report viewer window, click the File menu and select Design Report.
All of these methods will launch the Design Report window:
See below for basic information about the Design Report window and the features most commonly used for GainSeeker reports. For in-depth documentation of the features in this window, see the Active Reports 13 User Guide at https://www.hertzler.com/activereports13help.
![]()
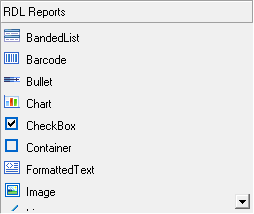
You can drag one of these report controls and drop it on the layout area of the report. You can also click one of these controls and then click the layout area of the report.
Some of these report controls—Table, List, Banded List, Tablix, and Chart—are specially categorized as Data Regions. This means that they can contain other report controls (including other data regions) to repeat for all rows of information in a single dataset.
For more details on these report controls, see https://www.hertzler.com/activereports13help/controls.
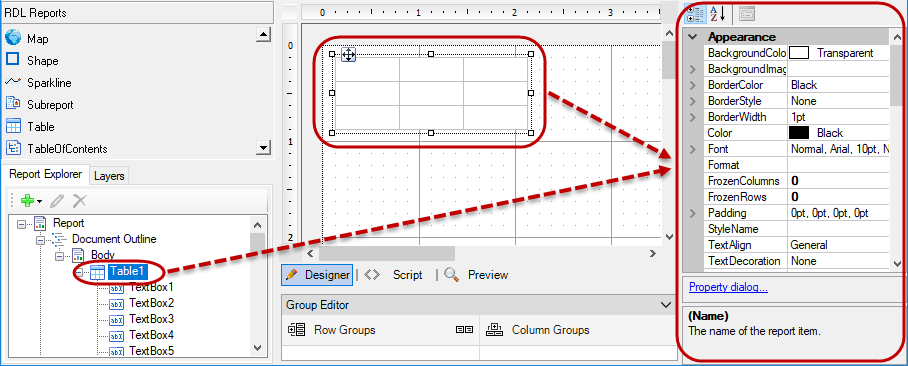
As you add controls to the report, they will appear in the Document Outline.
You can use this area to click on a control and edit its properties, or right-click on a control and edit layout properties.
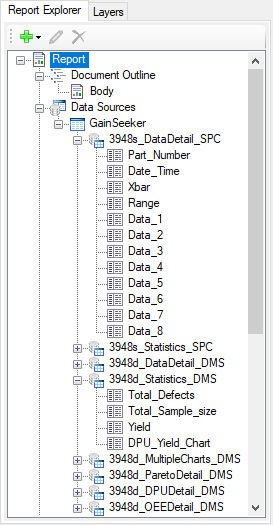
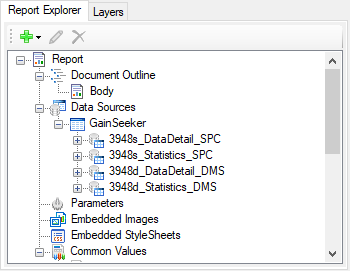
GainSeeker automatically creates the GainSeeker data source for you. Depending on the retrievals you specified for this dynamic report, GainSeeker will also provide one or more datasets for the values that GainSeeker will provide to the report:
If you selected one or more Columns for the report, these will be available in a DataDetail dataset. For an Advanced retrieval, the contents of the DataDetail dataset will depend on SQL statement you provided for the report.
If you selected one or more Statistics for the report, these will be available in the DataDetail dataset, the Statistics dataset, or both, depending on the Statistics Location you selected for providing statistics to the report.
If you selected Charts, multiple-part number or multiple-process charts are provided in another dataset. Single-retrieval charts will be available in the DataDetail dataset, the Statistics dataset, or both, depending on the Statistics Location you selected for providing statistics to the report.
|
If you selected Pareto detail, DPU detail, and/or OEE detail, another dataset will be added for each option you selected.
![]() Please note: Most
of the values in these GainSeeker datasets are strings.
The exceptions to this are:
Please note: Most
of the values in these GainSeeker datasets are strings.
The exceptions to this are:
Data type: |
Integer |
Double |
Statistic: |
|
|
Most strings that contain only numbers will accept formatting for decimals simply by setting the Format property. If that does not function as desired, you can use functions like ToDouble() or ToInt32() in the Value property to return a numeric value that will accept numeric formatting.
Strings that contain date/time values will only accept other Format property if you first set their value using ToDateTime().
For example: The Date_Time value listed in the DataDetail dataset is recognized by this module as a string value instead of a true date/time value. If you need to change the format of these date/time stamps, you should: first change the Value property from =Fields!Date_Time.Value to =ToDateTime(Fields!Date_Time.Value) . Then you can change the Format property to one of the predefined format codes for dates and times or enter a custom format string (e.g., yy/MM/dd HH:mm:ss).
To retrieve information from sources outside of the GainSeeker database, you can define another Data Source and dataset. For more information, see https://www.hertzler.com/activereports13help/datasources_and_datasets.
|
You can use parameters to filter the information displayed in reports.
You can import an image file into your report as an embedded image which can be displayed by the "image" control.
These are values that are commonly displayed on reports.
The Layout area is displayed in the center of the Design Report window and allows you to work with the report layout, add custom script to the report, and preview the report.
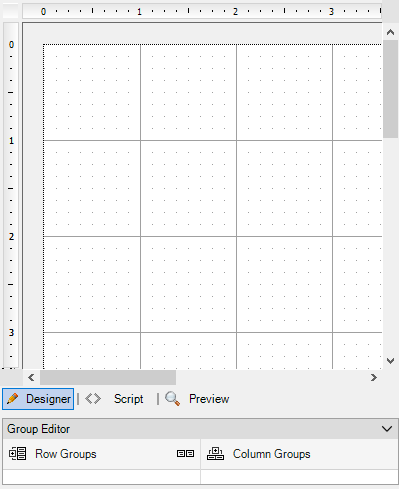
You can use the property grid on the right-hand side to modify some of the contents and formatting of the control that you have selected on the Document Outline or on the layout area. You can also use it to modify properties of the report and the body of the report.
When the  button is selected,
you can:
button is selected,
you can:
drag and drop controls onto the body of the report
move and re-size controls on the body of the report
change the contents of a control on the report
click a control on the Document Outline or on the layout area and then use the property grid to change the properties of that control
click Report on the Document Outline and then use the property grid (or the Property dialog link below the grid) to change report properties including Portrait/Landscape, print margins, etc.
![]() Tip:
If object spacing looks correct on the layout area when designing the
report but gets cut off when viewing the report, you may need to change
the Report property for
ConsumeWhiteSpace
to False.
Tip:
If object spacing looks correct on the layout area when designing the
report but gets cut off when viewing the report, you may need to change
the Report property for
ConsumeWhiteSpace
to False.
use the designer buttons 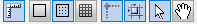 for
the layout area
for
the layout area
To add custom script to your report, click
the  button.
and the Custom
code sample: count unique values.
button.
and the Custom
code sample: count unique values.
If you create or edit a dataset in order to add or change a field in that dataset, avoid using the these characters in the Name of any field. |
To quickly preview your report as you work,
click the  button.
Another option is to simply view the report.
At any time, you can save your changes to
the report by clicking the ![]() button,
clicking the File menu and then
clicking Save, or pressing CTRL+S.
button,
clicking the File menu and then
clicking Save, or pressing CTRL+S.
To view the report, click the File menu and then click Save & View Report.
To change the retrievals for the report, click the File menu and then click Save & Edit Retrievals.
For in-depth documentation of the features in this window, see the Active Reports 13 User Guide at https://www.hertzler.com/activereports13help.