|
Contents [Hide] |
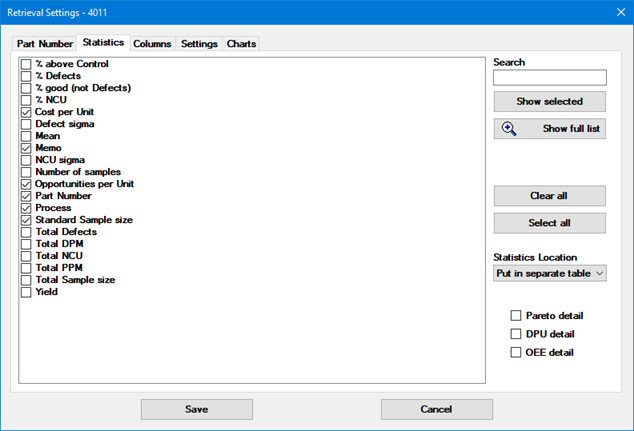
This tab is available for all Retrieval types.
On this tab, you can choose which statistics (if any) to provide to the report Design. You can use the Show full list button to toggle between a short list of commonly-used statistics and the full list of available statistics. You can also choose Custom statistics.
Please note that a Scripted DMS retrieval cannot perform DMS cost analysis where cost information comes from the standard's cost per unit. This includes the statistics Total sample cost and Total NCU cost.
If you choose statistics for the retrieval, you also need to choose how they will be provided to the report.
For an SPC Retrieval, GainSeeker will perform a separate statistical analysis of the data retrieved for each standard.
For a DMS Retrieval, GainSeeker will perform a separate statistical analysis for each group, according to the Group statistics/data by option selected on the Part Number tab.
When you design the report, a single data region – such as a list or a matrix – will only be able to report information from a single dataset of information.
A dataset can include statistics, raw data values, or both. However, some options will work more slowly and use more system resources on your computer than others.
The Statistics Location list lets you choose how these datasets will be provided to the report Design:
Put in separate table
With this option, GainSeeker will provide two datasets (similar to tables of data) to the report:
A dataset of raw data values will include one row of raw data values for every data record that is retrieved.
A dataset of statistics will include one row of statistics values for every standard for which data is retrieved.
Values that are provided to the report can be thought of like this:
Data |
||||
Part Number |
Date/Time |
Shift |
X-bar |
Range |
225 height |
2/1/2010 07:35 |
1 |
3.754 |
.003 |
225 height |
2/1/2010 16:20 |
2 |
3.751 |
.001 |
... |
... |
... |
... |
... |
225 height |
2/28/2010 23:30 |
3 |
3.749 |
.004 |
987 height |
2/1/2010 06:40 |
1 |
212.6 |
1.1 |
987 height |
2/1/2010 15:53 |
2 |
212.1 |
0.6 |
... |
... |
... |
... |
... |
987 height |
2/1/2010 23:10 |
3 |
211.9 |
1.3 |
Statistics |
|||
Part Number/Process |
Cpk |
Distribution |
% out of Control |
225 height |
1.53 |
Normal |
0.61% |
987 height |
1.97 |
Non-normal (modeled) |
0.19% |
When you design a report to include this information, you will need to set up one data region to report information from the dataset of raw data and a second data region to report information from the statistics dataset.
Add statistics to data
This option will provide a single dataset of raw data values, where the statistics for each standard are also included on every row of raw data values for that standard.
Values that are provided to the report can be thought of like this:
Data |
||||||||
Part Number |
Date/Time |
Shift |
X-bar |
Range |
Part |
Cpk |
Distribution |
% out of Control |
225 height |
2/1/2010 07:35 |
1 |
3.754 |
.003 |
225 height |
1.53 |
Normal |
0.61% |
225 height |
2/1/2010 16:20 |
2 |
3.751 |
.001 |
225 height |
1.53 |
Normal |
0.61% |
... |
... |
... |
... |
... |
... |
... |
... |
... |
225 height |
2/28/2010 23:30 |
3 |
3.749 |
.004 |
225 height |
1.53 |
Normal |
0.61% |
987 height |
2/1/2010 06:40 |
1 |
212.6 |
1.1 |
987 height |
1.97 |
Non-normal (modeled) |
0.19% |
987 height |
2/1/2010 15:53 |
2 |
212.1 |
0.6 |
987 height |
1.97 |
Non-normal (modeled) |
0.19% |
... |
... |
... |
... |
... |
... |
... |
... |
... |
987 height |
2/1/2010 23:10 |
3 |
211.9 |
1.3 |
987 height |
1.97 |
Non-normal (modeled) |
0.19% |
When you design a report to include this information, you can set up a single data region to report both the raw data and statistics. However, if you want to design a portion of the report that displays a summary grid of statistics for each standard, this is easier to achieve from a simple statistics dataset (using either of the other two options).
Add statistics to data and in a separate table
With this option, GainSeeker will provide two datasets to the report:
A dataset of raw data values will include one row of raw data values for every data record that is retrieved. In addition, the statistics for each standard are also included on every row of raw data values for that standard.
A dataset of statistics will include one row of statistics values for every standard for which data is retrieved.
Values that are provided to the report can be thought of like this:
Data |
||||||||
Part Number |
Date/Time |
Shift |
X-bar |
Range |
Part |
Cpk |
Distribution |
% out of Control |
225 height |
2/1/2010 07:35 |
1 |
3.754 |
.003 |
225 height |
1.53 |
Normal |
0.61% |
225 height |
2/1/2010 16:20 |
2 |
3.751 |
.001 |
225 height |
1.53 |
Normal |
0.61% |
... |
... |
... |
... |
... |
... |
... |
... |
... |
225 height |
2/28/2010 23:30 |
3 |
3.749 |
.004 |
225 height |
1.53 |
Normal |
0.61% |
987 height |
2/1/2010 06:40 |
1 |
212.6 |
1.1 |
987 height |
1.97 |
Non-normal (modeled) |
0.19% |
987 height |
2/1/2010 15:53 |
2 |
212.1 |
0.6 |
987 height |
1.97 |
Non-normal (modeled) |
0.19% |
... |
... |
... |
... |
... |
... |
... |
... |
... |
987 height |
2/1/2010 23:10 |
3 |
211.9 |
1.3 |
987 height |
1.97 |
Non-normal (modeled) |
0.19% |
Statistics |
|||
Part Number/Process |
Cpk |
Distribution |
% out of Control |
225 height |
1.53 |
Normal |
0.61% |
987 height |
1.97 |
Non-normal (modeled) |
0.19% |
This option provides the slowest performance when opening a report, and it uses the greatest amount of system resources on your computer.
![]() Note: When you set up the report
Design and add fields
for data columns and statistics fields to your report layout, this Statistics Location becomes part
of the name of those fields. If you later change this Statistics
Location, you will need to edit the report Design and update all
of those field references.
Note: When you set up the report
Design and add fields
for data columns and statistics fields to your report layout, this Statistics Location becomes part
of the name of those fields. If you later change this Statistics
Location, you will need to edit the report Design and update all
of those field references.
When you are setting up a DMS retrieval, the Statistics tab provides you with additional options: Pareto detail, DPU detail, and OEE detail.
If you select the Pareto detail check box, GainSeeker will provide an additional dataset that you can use to report information for each Pareto bar (based on the settings for the report). The results of this dataset are similar to the Pareto Detail report for Pareto charts in the GainSeeker Charts module.
For example, a report that sorts Pareto bars by Part Number might provide values like this to the report:
Category (part number) |
Sum Defects |
NCU |
Sample size |
Yield |
DPM |
D-34KW Connector |
413 |
416 |
29757 |
98.6 |
13879 |
E-34KB Cover |
308 |
311 |
18982 |
98.4 |
16226 |
T-55ST Board |
296 |
301 |
17906 |
98.3 |
16531 |
Similarly, selecting the DPU detail check box will provide an additional dataset that you can use to report information for each plot point on a DPU chart. The results of this dataset are similar to the Defect Detail report for DPU charts in the GainSeeker Charts module.
For example, a report that groups DPU points by week might provide values like this to the report:
Group (year/week) |
Sum Defects |
NCU |
Sample size |
Yield |
DPM |
2008/52 |
123 |
123 |
6504 |
98.1 |
18911 |
2009/01 |
183 |
185 |
12576 |
98.5 |
14552 |
2009/02 |
139 |
139 |
10150 |
98.6 |
13695 |
Likewise, selecting the OEE detail check box will provide an addition dataset that you can use to report information for each plot point on a OEE chart. The results of this dataset are similar to the OEE Detail report in the GainSeeker Charts module.
It is possible for GainSeeker to calculate some of the SPC or DMS statistics and provide them to an Advanced retrieval.
For example, to let GainSeeker calculate the Mean for SPC data with a subgroup size of 3 or less, your SQL query must return columns named DATA1, DATA2, DATA3 and SUBSIZE. If the table you are querying does not contain columns with these names, you can use the syntax SELECT <column_name1> as DATA1, <column_name2> as DATA2, ... so that the columns in the query result set still have the names that GainSeeker needs for calculating statistics.
For example, GainSeeker cannot calculate the Cpk for an Advanced retrieval, because specification limits are needed to calculate this statistic and specification limits are stored in the SPC standard.
If you choose any statistics that GainSeeker cannot calculate for the reasons listed above, GainSeeker will simply fail to calculate that statistic or provide it to the report.