Note: Labels and Titles settings and all
other settings in the Chart overrides
node can be saved as a chart skin. See Chart
Skins for more information.
Note: Labels and Titles settings and all
other settings in the Chart overrides
node can be saved as a chart skin. See Chart
Skins for more information.Use the Labels and Titles node on the Settings tab to temporarily override the default settings for the display label and title options for all DMS chart types. An example of a display label is the label for the line representing control limits on a chart.
Note: Labels and Titles settings and all
other settings in the Chart overrides
node can be saved as a chart skin. See Chart
Skins for more information.
|
Contents [Hide] |
Navigate to the Labels and Titles settings following this path on the Settings tab by following this path:
Chart overrides | Labels and Titles
See DMS labels for information
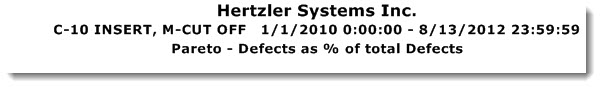
Designate up to three rows of titles to display above a chart. Expand the Chart titles node to display the label options.
The following examples show the settings for the three title lines and as the settings might display on the chart:
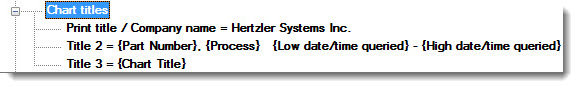
Print title / Company name =
The top title row, which is often used for a company or department name or other display text.
Right-click the Print title / Company name = option under the Settings tab Chart title tree node.
The Enter Value dialog opens.
Enter a title in the text box field.
The middle title row, which is often used for statistics, chart type names ("Control chart," for example), or user-added text.
Right-click the Title 2 = option under the Settings tab Chart title tree node.
The Define Chart Title dialog opens. See Using the Define Chart Title dialog.
Title 3
The bottom title row, which is often used to display the chart type names ("Control chart," for example), statistics, or user-added text.
Right-click the Title 3 = option under the Settings tab Chart title tree node.
The Define Chart Title dialog opens. See Using the Define Chart Title dialog.
Opt to always display limit and chart axis labels (regardless of chart window sizing), let the software decide the label size (based on chart sizing), or opt to never display labels. Double-click Display limit and chart axis labels to expand the node and display the options.
Always display labels. Limit and chart axis labels will always display, regardless of how a user sizes the chart window.
Let software decide base on expected readability. GainSeeker displays the limit and chart axis labels based on the expected readability of the labels based on the user-selected chart window size.
Never display labels. Limit and chart axis labels are not displayed on the chart.
Change the labels used to designate the line limits on a new or existing chart. Short labels are recommended if you display more than one set of limits on a chart. Expand the Limit labels node to display the label options.
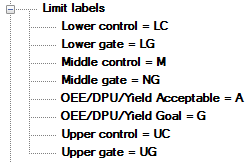
Double-click on a label name. Enter a new label name in the dialog that opens.
Note: For the Limit labels and data labels to display, the Always display labels or the Let software decide based on expected readability option under the Display limit and chart axes labels node must be selected. See Display limit and chart axes labels within this topic.
Set the X-axis label attributes for DMS Control charts.
Display date format =
Specify a date time format string for the X-axis when date labels are selected for the X-Axis. For example, you could change the format from Year/Month/Day to Month/Day/Year. See Date/Time Formats
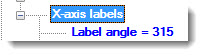
Label angle =
Set the angle at which the X-axis labels display on a DMS Control chart. Expand the Label angle = node to display the label options.
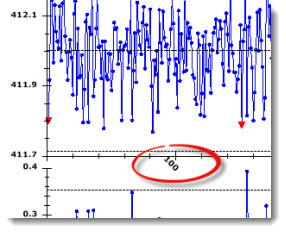
Angle down was selected for the labels on the following chart example:
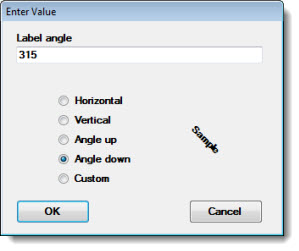
The Enter Value dialog opens.
Click an option to select it. The word "Sample" will change to reflect the selected angle and the Label angle text box will display the degree of the angle.
Or, you can select Custom and enter the degree of the angle you want in the Label angle text box.
Label frequency =
Set the label display frequency on a chart. Expand the label frequency node to display the label options. The Label frequency setting only applies if the Label type value is set to Date or Traceability, but not to Count.
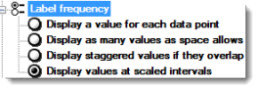
Display a value for each data point. Displays a label for each chart value.
Display as many values as space allows. Displays only as many values as the space allowed for the chart window.
Display staggered values if they overlap. GainSeeker staggers the value labels if they will overlap.
Display values at scaled intervals. Displays value labels at scaled intervals. A good option for avoiding an overload of chart labels if there are numerous data points.
Select whether to label the X-axis by Count, Date, or a Traceability field. Expand the label type node to display the label options.
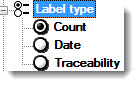
If Date is selected, see Options for date labels
If Traceability is selected, see Options for traceability labels
Set the display length for traceability labels. Expand the Options for traceability labels node to display the label options.
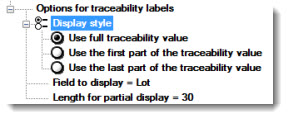
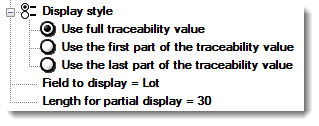
Note: For this setting to apply, the Label type must be set to Traceability. Expand the Display style node to display the label options.
Use full traceability value. Displays the entire value. A good option to select for displaying short traceability values.
Use the first part of the traceability value. Displays only the first n numbers of a traceability value. A good option to select for lengthy values if the first n numbers are unique and the succeeding numbers are always the same, for example: 111120000, 111220000, 111320000.... .See Length for partial display = to set the value for n.
Use the last part of the traceability value. Displays only the last n numbers of a traceability value. A good option to select for lengthy values if the last n numbers are unique and the preceding numbers are always the same, for example: 200000111111, 200000111112, 200000111113, 200000111114.... . See Length for partial display = to set the value of n.
Field to display =
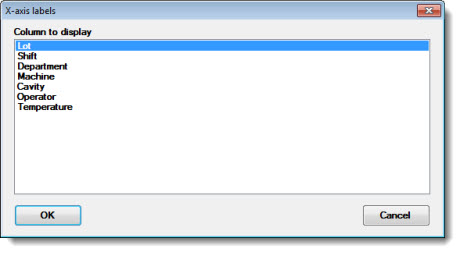
Select a traceability field to display on the X-axis.
Double-click Field to display =.
The X-axis labels dialog opens.
Select a label from the Column to display list.
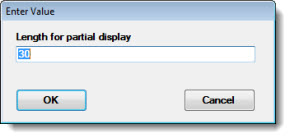
Select the number of characters to display for the X-axis value. Note: For this setting to apply, the Display style must be set to Use the first part of the traceability value or Use the last part of the traceability value. See Display style
Double-click Length for partial display =.
The Enter Value dialog opens.
Enter a numeric value in the Length for partial display text box representing the number of characters to display for the traceability value (30 or less).