Note: Lines and Limits settings and all other settings in the Chart overrides node on the Settings dialog can be saved as a chart skin. See Chart Skins for more information.
Use the Lines and Limits node on the Settings tab to set the display lines and limits options for a DMS chart.
You can assign default settings to charts in the GainSeeker System Administration module. See Chart Defaults settings
Note: Lines and Limits settings and all other settings in the Chart overrides node on the Settings dialog can be saved as a chart skin. See Chart Skins for more information.
|
Contents [Hide] |
Navigate to the Lines and Limits node (for temporary changes):
Chart overrides | Lines and Limits
Configurations | (configuration name) | Charts defaults | Shared (DMS and SPC) | Lines and Limits |
Select the position of the tick lines in relation to the Y-axis and X-axis lines on the chart.
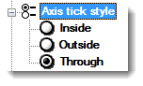
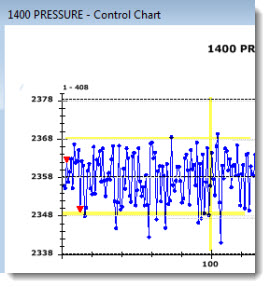
In the following example, the Through option is selected. The tick lines (diagrammed in yellow) cross through the Y-axis and X-axis lines. If Inside is selected, the tick lines will position inside the axis lines. Likewise, if Outside is selected, they will position outside the axis lines.
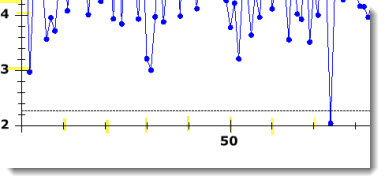
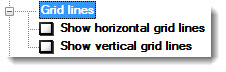
Show horizontal gridlines and show vertical gridlines are selected in the following example (highlighted in yellow in the following example).
Select the limits to display on a Control, DPU, or OEE chart.
Set the color, line type (solid or dash, for example), and the width of various lines on a chart. The options for each line type are the same: Line color, Line type, and Line width.
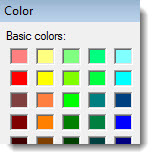
Double-click Line color = to open the Color dialog. Click a color to select it.
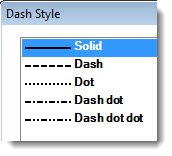
Line type =
Double-click Line type = to open the Dash Style dialog box. Click a style to select it.
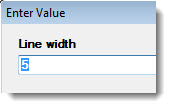
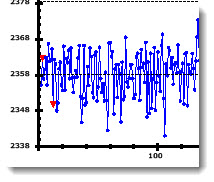
Double-click Line width = to open the Enter Value dialog. Enter a value in the text box that represents the line width. Following, is an example in which the X-axis and Y-axis lines have been widened to a line width of 5.