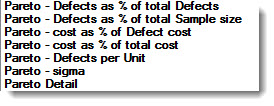
Pareto Charts allow you to group data categorically, such as by cost or defects. You can drill down multiple levels on a Pareto Chart to get to the root cause of a defect. For information, see Drill down to the Root Cause of a Defect. GainSeeker offers seven Pareto chart type options:
|
Contents [Hide] |
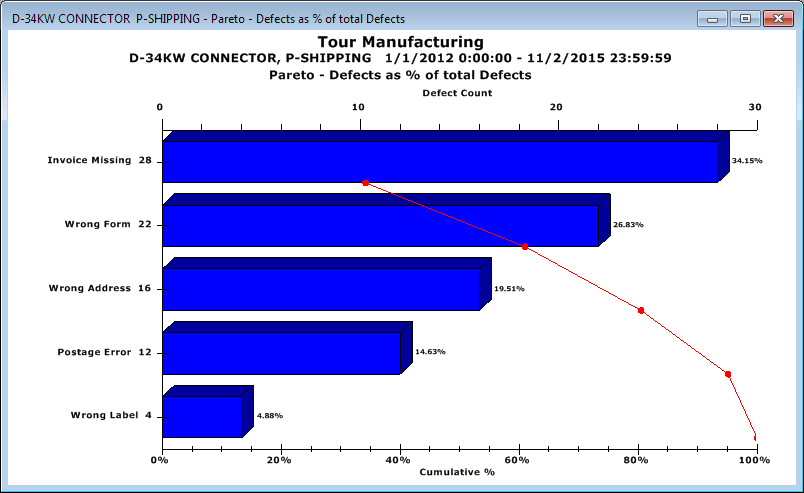
An example of a Pareto - Defects as % of total Defects chart follows, one of seven Pareto Chart options available on the Charts tab of the DMS Charts dialog.
For the following sample data set, each chart option will display the following results:
|
Sample data set |
||
|
Sample size: |
100 units |
$1.00/unit |
|
Defective units: |
10 units |
see defect costs below |
|
Defects: |
5 dents |
repair cost of $0.10/dent |
|
3 scratches |
repair cost of $0.01/scratch |
|
|
2 misaligned |
repair cost of $0.05/misalign |
|
|
Pareto Chart Options |
What is displayed |
|
Defects as % of total Defects |
Displays the total number of defects Categorizes them by the type of Defect Management System Displays what percentage of the total number of defects each defect is. Example: In the sample of 100 units, 50% of the defects are dents, 30% are scratches, and 20% are misaligned. |
|
Defects as % of total Sample size |
Displays what percentage of all the units examined have defects Categorizes those defects by type. Example: In the sample of 100 units, 5% of the sample are dents, 3% are scratches, and 2% are misaligned. |
|
Cost as a % of Defect cost |
Displays the cost of each defect category as a percentage of the total cost from all defects. Example: If cost is based on the cost per unit, then the total defect cost is $10, and 50% of the cost is from dents, 30% from scratches, and 20% from misaligned. If the cost is based on the defect cost, then the total defect cost is $0.63, and 79% of the cost is from dents, 5% of the cost is from scratches, and 16% of the cost is from misaligned. |
|
Cost as a % of total cost |
Displays the cost of defects as a percentage of the total cost of the sample. Example: If cost is based on the cost per unit, then the total defect cost is $100, and 5% of the cost is from dents, 3% from scratches, and 2% from misaligned. |
|
Defects per Unit |
Displays the number of units with defects, rather than the total number of defects on all the units. Example: If our product could have more than one defect per unit, then we might see 5 dents, 3 scratches and 2 misaligned, but we might have only 3 units with all of those defects. (Defects do not equal nonconforming units.) In that situation, the graph would show that there are 3 units with defects. |
|
Sigma |
An index of the parts per-million defective. |
|
Detail |
A Pareto Detail lets you view the data supporting charts as numerical values using a table format. You can add or change the statistics for columns on a Pareto Detail table. See Pareto detail columns = |
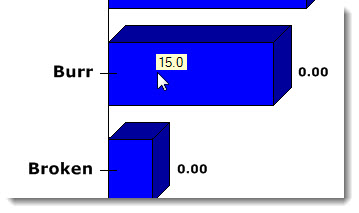
Click anywhere on a bar to display the defect frequency value for that bar (Figure 1)
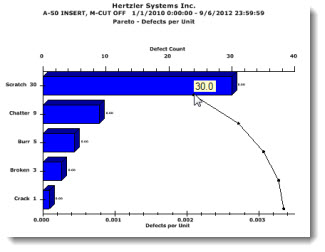
Click a point on the cumulative line to display the cumulative value of that point (Figure 2)