You can easily display the data records behind any chart. A Data Table containing the chart information will display on the GainSeeker Charts window along with the chart.
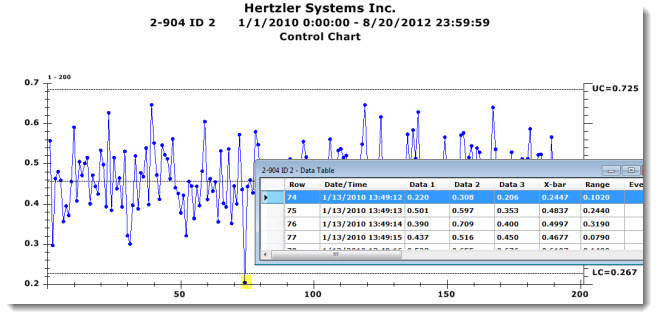
On any Control Chart, you can additionally view records for any data point you select on the chart. Following is a Data Table with the data record highlighted that corresponds to that point on the Control Chart.
|
Contents [Hide] |
Right-click anywhere on a chart. Then, select Show Data on the menu that displays,
-or-
-or-
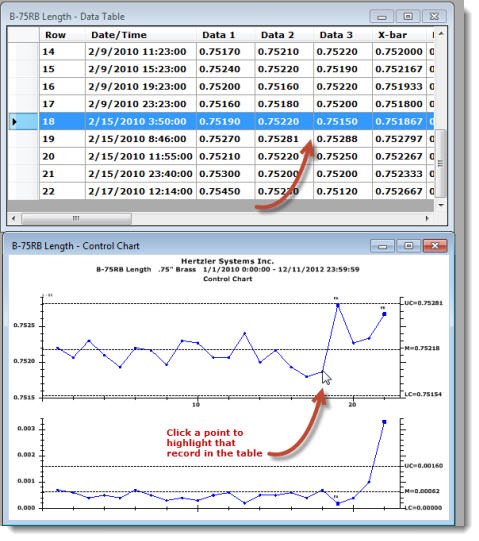
A Data Table opens highlighting the row of the table that corresponds to the data point you selected on the chart. The original chart also remains open on the GainSeeker charts window.
You can double-click successive data points on the chart to view the record for each. GainSeeker will highlight the record for that data point on the Data Table. Repeat this action for each data point you want to highlight on the Data Table. It is recommended that you Tile the Data Table and the chart on the GainSeeker Charts window when using this function.
To efficiently display the chart and its corresponding Data Table on the GainSeeker Charts window so you can switch between the two:
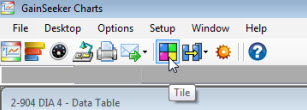
The chart window and the table window align on the GainSeeker Charts window.