DMS statistics available

You can choose from a list of DMS statistics when performing tasks such as:


Contents  [Hide]


You can define the labels used for all of these statistics. The system uses a code number to identify each statistic when it stores items such as dashboards and statistics list formats.

Some of the default labels will automatically change if you change Shared labels such as the Part label or Process label, or if you change DMS labels such as the Defect label or the Unit label. These portions of the default statistics labels are displayed in italics in the tables below.

There are these categories of DMS statistics:

Basic statistics

Default label

Explanation

Code

Process

If you selected a single process to analyze, this will return the name of that process.

Otherwise, it returns "NA" (on statistics lists, statistical filter dashboards and dynamic reports) or "Multi-Process" (on chart titles and KPI gage dashboards).

0

Part Number

If you selected a single standard (Part Number + Process) to analyze, this will return the Part Number portion of that standard name.

Otherwise, it returns "NA" (on statistics lists, statistical filter dashboards and dynamic reports), "Multi-Part Number" (on chart titles) or "Multi-Part Number, Multi-Process" (on KPI gage dashboards).

1

Cost per Unit

If you selected a single standard (Part Number + Process) to analyze, this will return Cost per Unit from that standard.
Otherwise, it returns "NA".

2

Opportunities per Unit

If you selected a single standard (Part Number + Process) to analyze, this will return Opportunities per Unit from that standard.
Otherwise, it returns "NA".

3

Filter contents

If you set a filter, or if the program needs to filter the data (e.g., to group the rows on a Statistical Filter dashboard), this returns the contents of that filter (such as "Shift = '1' ").
Otherwise, it returns "Not set".

4

Filter

If you set a filter, this returns the name of that filter. If you set a Quick Filter, this returns "Quick Filter".
Otherwise, it returns "Not set".

5

High date/time queried

The high date/time you specified for this chart, dashboard, or dynamic report.

6

Low date/time queried

The low date/time you specified for this chart, dashboard, or dynamic report.

7

Defects in relation to

If calculating Defects per Total Units, this returns "Units".
If calculating Defects per Opportunities for total Units, this returns "Opportunities".

8

Cost from

If using cost information from the Standard list, this returns "Standard".
If using cost information from a Traceability list, this returns "Traceability".
If using cost information from the Defect list, this returns "Defect".
If bypassing cost to improve speed, this returns "NA".

9

Selected Defects

If analyzing data for all defects, this returns "[Include all Defects]".
If you selected all of the defects from a specific process, this returns "<process name> Defects only".
If you selected any other combination of defects, this returns "[Select specific defects]".

10

High date/time retrieved

The highest date/time stamp that was retrieved for this chart, dashboard, or dynamic report.

11

Low date/time retrieved

The lowest date/time stamp that was retrieved for this chart, dashboard, or dynamic report.

12

Number of samples

The number of data records that were retrieved for this chart, dashboard, or dynamic report.

13

Total Sample size

If Defects in relation to = "Units", this returns the sum of the sample sizes retrieved for this chart, dashboard or dynamic report (equivalent to Total Units).

If Defects in relation to = "Opportunities", the label changes to Total opportunities and this statistic is calculated as:

Standardn total units * Standardn opportunities per unit

14

% zero Defects

Percentage of retrieved data records that have zero defects.

15

Maximum value

In the GainSeeker Charts, Dynamic Reports, and PC Collect modules, this returns the highest plot point on a control chart for the retrieved data. This value is scaled according to the Display u and p data as setting for the current report – DPM/PPM, Percent or Proportion.

In all other modules:

When Chart type = "Control", this uses the same calculation as the GainSeeker Charts, Dynamic Reports, and PC Collect modules.

When Chart type = "Pareto", this returns the count for the maximum Pareto category for the retrieved data.

When Chart type = "DPU", this returns the highest plot point on a DPU chart scaled as number of defects per million units for the retrieved data.

16

Minimum value

In the GainSeeker Charts, Dynamic Reports, and PC Collect modules, this returns the lowest plot point on a control chart for the retrieved data. This value is scaled according to the Display u and p data as setting for the current report – DPM/PPM, Percent or Proportion.

In all other modules:

When Chart type = "Control", this uses the same calculation as the GainSeeker Charts, Dynamic Reports, and PC Collect modules.

When Chart type = "Pareto", this returns the count for the minimum Pareto category for the retrieved data.

When Chart type = "DPU", this returns the lowest plot point on a DPU chart scaled as number of defects per million units for the retrieved data.

17

Total Defects

The sum of the defect counts in the data records that were retrieved for this chart, dashboard, or dynamic report.

18

Total Defects cost

In the GainSeeker Charts, Dynamic Reports, and PC Collect modules, this is calculated from the retrieved data as:

If Cost from = "Standard" or Cost from = "Defect":

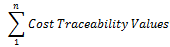
If Cost from = "Traceability":

In all other modules:

If Cost from = "Standard", this is calculated from the retrieved data as:

If Cost from = "Defect", this uses the same calculation as the GainSeeker Charts, Dynamic Reports, and PC Collect modules.

If Cost from = "NA", this returns a cost of 0.

19

Total sample cost

In the GainSeeker Charts, Dynamic Reports, and PC Collect modules, this is calculated from the retrieved data as:

Standardn total units * Standardn cost

When analyzing external data or using a scripted retrieval, this returns a cost of $0.00 .

In all other modules:

If Cost from = "Standard" or "Defect", this uses the same calculation as the GainSeeker Charts, Dynamic Reports, and PC Collect modules.

If Cost from = "NA", this returns a cost of 0.

20

% Defects

If Total Sample size > 0, this is calculated as:
(Total Defects / Total Sample size) * 100

Otherwise, it returns "NA".

21

% good (not Defects)

If Total Sample size = 0 or Total Sample size < Total Defects, this returns "NA".

Otherwise, this is calculated as:
((Total Sample size - Total Defects)/Total Sample size) * 100

22

Defect sigma

If Total DPM = "NA", this returns "NA".

Otherwise, this uses Total DPM to extrapolate the Defect sigma based on the following table:

Total DPM

Defect sigma

> 501350

< 1.5

501350

1.5

308770

2.0

158687

2.5

66810

3.0

22750

3.5

6210

4.0

1350

4.5

232.9

5.0

31.8

5.5

3.4

6.0

< 3.4

> 6.0

23

Total DPB

If Total Sample size > 0, this is calculated as:
(Total Defects / Total Sample size) * 1 billion

Otherwise, it returns the number 0.

If Defects in relation to = "Opportunities", the label changes to Total DPBO.

24

Total DPM

If Total Sample size > 0, this is calculated as:
(Total Defects / Total Sample size) * 1 million

Otherwise, it returns the number 0.

If Defects in relation to = "Opportunities", the label changes to Total DPMO.

25

Chart type

For Pareto chart analysis of the retrieved data, this returns "Pareto".
For DPU chart analysis of the retrieved data, this returns "DPU".
For control chart analysis of the retrieved data, this returns "Control".
How the Charts and Reports module sets the Chart type

How the Enterprise Dashboard module sets the Chart type

26

DPM method

This returns "Additive" or "Average" and reflects the Method to handle DPM across processes selected.

27

Total NCU

The sum of the nonconforming units retrieved for this chart, dashboard or dynamic report.

28

Total DPK

If Total Sample size > 0, this is calculated as:
(Total Defects / Total Sample size) * 1000

Otherwise, it returns the number 0.

If Defects in relation to = "Opportunities", the label changes to Total DPKO.

29

Total PPK

If Total Units > 0, this is calculated as:
(Total NCU / Total Units) * 1000

Otherwise, it returns the number 0.

30

Total PPM

If Total Units > 0, this is calculated as:
(Total NCU / Total Units) * 1 million

Otherwise, it returns the number 0.

31

Total PPB

If Total Units > 0, this is calculated as:
(Total NCU / Total Units) * 1 billion

Otherwise, it returns the number 0.

32

NCU sigma

If Total NCU = "NA", this returns "NA".

Otherwise, this uses Total NCU to extrapolate the NCU sigma based on the following table:

Total NCU per million units

NCU sigma

> 501350

< 1.5

501350

1.5

308770

2.0

158687

2.5

66810

3.0

22750

3.5

6210

4.0

1350

4.5

232.9

5.0

31.8

5.5

3.4

6.0

< 3.4

> 6.0

33

% NCU

In the GainSeeker Charts, Dynamic Reports, and PC Collect modules, this is calculated from the retrieved data as:

If Total Units > 0, this is calculated as:
(Total NCU / Total Units) * 100

Otherwise, it returns "NA".

In all other modules:

If Total Sample size > 0, this is calculated as:
(Total NCU / Total Sample size) * 100

Otherwise, it returns "NA".

34

% good Units

In the GainSeeker Charts, Dynamic Reports, and PC Collect modules, this is calculated from the retrieved data as:

If Total Units = 0, this returns "NA".

Otherwise, this is calculated as:
((Total Units - Total NCU)/Total Units) * 100

In all other modules:

If Total Sample size = 0, this returns "NA".

Otherwise, this is calculated as:
((Total Sample size - Total NCU)/Total Sample size) * 100

35

Current date/time

The computer clock date and time when this chart, dashboard or dynamic report was generated or refreshed.

36

Yield

In the GainSeeker Charts, Dynamic Reports, and PC Collect modules, this is calculated from the retrieved data as:

If Total Units = 0, this returns "NA".

Otherwise, this is calculated as:
((Total Units - Total NCU)/Total Units) * 100

In all other modules:

If Total Sample size = 0, this returns "NA".

Otherwise, this is calculated as:
((Total Sample size - Total NCU)/Total Sample size) * 100

37

Total good Units

Calculated from the retrieved data as Total Sample size - Total NCU

38

Total good samples

The number of retrieved data records that have zero NCU.

39

Total NCU cost

In the GainSeeker Charts, Dynamic Reports, and PC Collect modules, this is calculated from the retrieved data as:

If Cost from = "Standard" or Cost from = "Defect":

If Cost from = "Traceability"

When analyzing external data or using a scripted retrieval, this returns a cost of $0.00 .

In all other modules:

If Cost per Unit is "NA", then this statistic also reports "NA".

Otherwise, this is calculated as
Cost per Unit * Total NCU

40

Current date

The computer clock date when this chart, dashboard, or dynamic report was generated or refreshed.

41

Current time

The computer clock time when this chart, dashboard, or dynamic report was generated or refreshed.

42

High date queried

The "date" portion of the high date/time you specified for this chart, dashboard, or dynamic report.

43

High time queried

The "time" portion of the high date/time you specified for this chart, dashboard, or dynamic report.

44

High date retrieved

The "date" portion of the highest date/time stamp that was retrieved for this chart, dashboard, or dynamic report.

45

High time retrieved

The "time" portion of the highest date/time stamp that was retrieved for this chart, dashboard, or dynamic report.

46

Low date queried

The "date" portion of the low date/time you specified for this chart, dashboard, or dynamic report.

47

Low time queried

The "time" portion of the low date/time you specified for this chart, dashboard, or dynamic report.

48

Low date retrieved

The "date" portion of the lowest date/time stamp that was retrieved for this chart, dashboard, or dynamic report.

49

Low time retrieved

The "time" portion of the lowest date/time stamp that was retrieved for this chart, dashboard, or dynamic report.

50

Cumulative yield

This is calculated from the retrieved data as:

where = (Total Units - Total NCU) / Total Units for process x.

This statistic is also known as Rolled Throughput Yield.

51

Description

Not used.

52

Standard Sample size

If you selected a single standard (Part Number + Process) to analyze, this will return the Sample size from that standard or "NONE" if the Sample size in that standard is blank.
If you selected multiple standards to analyze, this will return "Not set".

53

Date period

The name of the Date period used to retrieve data for the current report, such as "Default Low to Today" or "Last week".

54

SQL query statement

The query statement used to retrieve the data for the current report.

55

Decimal places

The Number of decimals for a number for the current report.

56

Decimal places for cost

The Number of decimals for a cost value for the current report.

57

DPM best estimate

If the Method to calculate DPM for the current report is set to Best estimate, this returns "Yes". Otherwise, it returns "No".

58

DPM conservative

If the Use conservative calculation check box is selected for the current report, this returns "Yes". Otherwise, it returns "No".

59

DPM no zero

If the Never report zero check box is selected for the current report, this returns "Yes". Otherwise, it returns "No".

60

Show empty bars

If the Show pareto bars with no defects check box is selected for the current report, this returns "Yes". Otherwise, it returns "No".

61

Amount of time to display

The Show time to setting for the current report.

62

Memo

If you selected a single process to analyze, this will return the Memo from that process or "Not set" if the Memo in that process is blank.
If you selected multiple processes to analyze, this will return "Not set".

63

Sum NCU

If the Set nonconforming units = number of defects check box is selected for the current configuration, this returns "Yes". Otherwise, it returns "No".

64

Total Units

The sum of the sample sizes in the data records that were retrieved for this chart, dashboard or dynamic report. Not affected by the Defects in relation to statistic.

65

Total samples NCU > 0

The number of retrieved data records that have NCU > 0.

66

% samples NCU > 0

If Number of samples > 0, this is calculated as:
(Total samples NCU > 0 / Number of samples) * 100

Otherwise, it returns "NA".

67

Pareto statistics

Default label

Explanation

Code

Drill-down conditions

Returns a list of drill-down actions taken up to the current data set. If no drill-down action is taken, it returns "None".

103

Sort by

This is the Sort data for pareto chart bars by setting for the current report.

In GainSeeker Legacy modules:
When Chart type = "Pareto", this is the Sort data for pareto chart bars by setting for the current chart or dashboard. (In the Enterprise Dashboard module, this reflects the Sort data for pareto chart bars by configuration setting.)

When Chart type = "Control" or "DPU", this returns "NA".

100

Maximum pareto category

The count for the maximum Pareto category for the retrieved data.

101

Minimum pareto category

The count for the minimum Pareto category for the retrieved data.

102

DPU (Defects per Unit) statistics

Default label

Explanation

Code

Group by

This is the Group data for DPU chart by setting for the current report.

In GainSeeker Legacy modules:When Chart type = "DPU", this is the Group data for DPU chart by setting for the current chart or dashboard. (In the Enterprise Dashboard module, this reflects the Group data for DPU chart by configuration setting.)

When Chart type = "Pareto" or "Control", this returns "NA".

200

Improvement start date

If you selected a single Process to analyze, this will return the Improvement start date from that Process. If no Improvement start date exists for that Process, this statistic returns nothing.

If you selected multiple Processes to analyze, this statistic returns "Not set".

If you entered a different Improvement start date in the Standard overrides section, that value will be returned by this statistic.

In GainSeeker Legacy modules: When Chart type = "DPU":
If you selected a single Process to analyze, this will return the Improvement start date from that Process. If no Improvement start date exists for that Process, this statistic returns "NA".
If you selected multiple Processes to analyze, and GainSeeker prompted you to choose a single process for its Improvement start date and Improvement start value, then this will return the Improvement start date from that Process.

When Chart type = "Pareto" or "Control", this returns "NA".

You can also change this setting directly from a DPU chart. For more information, see Select DPU start date and value

201

Improvement start value

If you selected a single Process to analyze, this will return the Improvement start value from that Process. If no Improvement start value exists for that Process, this statistic returns "NONE".

If you selected multiple Processes to analyze, this statistic returns "0".

In GainSeeker Legacy modules:

When Chart type = "DPU":
If you selected a single Process to analyze, this will return the Improvement start value from that Process. If no Improvement start value exists for that Process, this statistic returns "NA".
If you selected multiple Processes to analyze, and GainSeeker prompted you to choose a single process for its Improvement start date and Improvement start value, then this will return the Improvement start value from that Process.

When Chart type = "Pareto" or "Control", this returns "NA".

You can also change this setting directly from a DPU chart. For more information, see Select DPU start date and value

202

Improvement goal

This is the DPU improvement goal setting for the current report.

In GainSeeker Legacy modules:

When Chart type = "DPU", this is the DPU improvement goal setting for the current chart or dashboard. (In the Enterprise Dashboard module, this reflects the DPU improvement goal configuration setting.)

When Chart type = "Pareto" or "Control", this returns "NA".

203

Maximum DPU group

The highest plot point on a DPU chart, scaled as number of defects per million units for the retrieved data.

204

Minimum DPU group

The lowest plot point on a DPU chart, scaled as number of defects per million units for the retrieved data.

205

Goal Yield

If you selected a single standard (Part Number + Process) to analyze, this returns the Goal Yield value set in the standard or "NONE" if the Goal Yield is not set.
If more than one standard is analyzed, this returns "NONE".
In GainSeeker Legacy modules, this does not return a value.

206

Acceptable Yield

If you selected a single standard (Part Number + Process) to analyze, this returns the Acceptable Yield value set in the standard or "NONE" if the Acceptable Yield is not set.
If more than one standard is analyzed, this returns "NONE".
In GainSeeker Legacy modules, this does not return a value.

207

Control Chart statistics

Default label

Explanation

Code

Sample size constant

This returns "Yes" if all of the retrieved data records contained the same Sample size. If more than one Sample size was found, this returns "No".

In GainSeeker Legacy modules:

When Chart type = "Control", this returns the same value as the GainSeeker Charts, Dynamic Reports, and PC Collect modules.

When Chart type = "Pareto" or "DPU", this returns "NA".

300

Data type

This returns "p", "np", "c" or "u". The value returned depends on the Data type setting for the current report and on the retrieved data.

In GainSeeker Legacy modules:

When Chart type = "Control", this returns "p", "np", "c" or "u".
In the DMS Charts and Reports module, the value returned depends on the Data type setting for the current chart and on the retrieved data.
In the Enterprise Dashboard module, the value returned depends on the Data type setting for the current configuration and on the retrieved data.

When Chart type = "Pareto" or "DPU", this returns "NA".

301

Exclude outliers

If the Exclude statistical outliers check box is selected, this statistic returns "Yes".
If the Exclude statistical outliers check box is cleared, this statistic returns "No".

In GainSeeker Legacy modules:

When Chart type = "Control":
In the DMS Charts and Reports module, the value returned depends on the Statistical Outliers setting for the current chart. If "Exclude outliers" is selected, this statistic returns "Yes". If "Include all data" is selected, this statistic returns "No".
In the Enterprise Dashboard module, the value returned depends on the Exclude statistical outliers setting for the current configuration. If the Exclude statistical outliers check box is selected, this statistic returns "Yes". If the Exclude statistical outliers check box is cleared, this statistic returns "No".

When Chart type = "Pareto" or "DPU", this returns "NA".

302

Standardized

If one or more retrieved data records has a sample size that varies from the average sample size by more than 25%, this returns "Yes".
If all of the retrieved data records have sample sizes that vary from the average sample size by 25% or less, this returns "No".

In GainSeeker Legacy modules:

When Chart type = "Control", this returns the same value as the GainSeeker Charts, Dynamic Reports, and PC Collect modules.

When Chart type = "Pareto" or "DPU", this returns "NA".

303

Lower Gate

If you selected a single standard (Part Number + Process) to analyze, this returns the lower gate value set in the standard or "NONE" if the lower gate is not set. This value is scaled according to Scale control data.
If more than one standard is analyzed, this returns "NA".

304

Upper Gate

If you selected a single standard (Part Number + Process) to analyze, this returns the upper gate value set in the standard or "NONE" if the upper gate is not set. This value is scaled according to Scale control data.
If more than one standard is analyzed, this returns "NA".

305

Nominal Gate

This returns (Upper Gate + Lower Gate)/2, or "NA" if the upper or lower gate limit is not defined. This value is scaled according to Scale control data.

306

Tolerance Gate

This returns Upper Gate - Lower Gate, or "NA" if the upper or lower gate limit is not defined. This value is scaled according to Scale control data.

307

% above Gate

The percent of samples that fall above the Upper Gate.
This returns "NA" if the upper gate limit is not defined.

308

% below Gate

The percent of samples that fall below the Lower Gate.
This returns "NA" if the lower gate limit is not defined.

309

% in Gate

The percent of samples that do not fall outside the Upper Gate and Lower Gate limits.
This returns "NA" if the upper or lower gate limit is not defined.

310

% out of Gate

The percent of samples that fall outside the Upper Gate and Lower Gate limits.
This returns "NA" if the upper or lower gate limit is not defined.

311

LCL

If Standardized = "No", this returns the lower control limit for the retrieved data. This value is scaled according to Scale control data.

If Standardized = "NA", this returns "NA".

If Standardized = "Yes":
The GainSeeker Charts, Dynamic Reports, and PC Collect modules return "Control limits (n)", where n is the number of display points.
All other modules return "NA".

312

UCL

If Standardized = "No", this returns the upper control limit for the retrieved data. This value is scaled according to Scale control data.

If Standardized = "NA", this returns "NA".

If Standardized = "Yes":
The GainSeeker Charts, Dynamic Reports, and PC Collect modules return "Control limits (n)", where n is the number of display points.
All other modules return "NA".

313

Mean

This returns the average of all plot points on a control chart for the retrieved data. This value is scaled according to Scale control data.

314

Maximum included

This returns the highest plot point that is not excluded on a control chart for the retrieved data. This value is scaled according to Scale control data.

315

Minimum included

This returns the lowest plot point that is not excluded on a control chart for the retrieved data. This value is scaled according to Scale control data.

316

% above Control

The percent of samples that fall above the upper control limit(s).
This returns "NA" if the upper control limit is not defined.

317

% below Control

The percent of samples that fall below the lower control limit(s).
This returns "NA" if the lower control limit is not defined.

318

% in Control

The percent of samples that do not fall outside the upper and lower control limits.
This returns "NA" if the upper or lower control limit is not defined.

319

% out of Control

The percent of samples that fall outside the upper and lower control limits.
This returns "NA" if the upper or lower control limit is not defined.

320

Chart in control

If % out of Control = 0, this returns "Yes".

If % out of Control > 0, this returns "No".

If the upper or lower control limit is not defined, this returns "NA".

321

Total excluded

If Exclude outliers = "Yes", this returns the count of the samples excluded.
Otherwise this returns the number 0.

322

Total included

If Exclude outliers = "Yes", this returns the count of the samples that are not excluded.
Otherwise this returns the Number of samples.

323

Default data type

Returns the Data type setting for the current report – "Auto", "p", "np", "c", or "u".

324

Scale control data

Returns the Display u and p data as setting for the current report – "DPM/PPM", "Percent" or "Proportion".

325

OEE (Overall Equipment Effectiveness) Statistics

Default label

Explanation

Code

OEE Availability

Returns the calculated OEE Availability statistic.

75

OEE Quality

Returns the calculated OEE Quality statistic.

76

OEE Performance

Returns the calculated OEE Performance statistic.

77

OEE

Returns the calculated OEE statistic.

78

OEE Sum Available Time

Returns the calculated OEE Sum Available Time statistic.

79

OEE Sum Scheduled Time

Returns the calculated OEE Sum Scheduled Time statistic.

80

OEE Sum (Good * Cycle Time)

Returns the calculated OEE Sum (Good * Cycle Time) statistic.

81

OEE Sum (Total * Cycle Time)

Returns the calculated OEE Sum (Total * Cycle Time) statistic.

82

OEE Group by

Returns the current OEE Group by chart setting.

83

OEE Acceptable

Returns the configuration setting for OEE Acceptable.

84

OEE Acceptable Availability

Returns the configuration setting for OEE Acceptable Availability.

85

OEE Acceptable Performance

Returns the configuration setting for OEE Acceptable Performance.

86

OEE Acceptable Quality

Returns the configuration setting for OEE Acceptable Quality.

87

OEE Goal

Returns the configuration setting for OEE Goal.

88

OEE Goal Available

Returns the configuration setting for OEE Available.

89

OEE Goal Performance

Returns the configuration setting for OEE Goal Performance.

90

OEE Goal Quality

Returns the configuration setting for OEE Goal Quality.

91

OEE Sum Downtime

Returns the calculated OEE Sum Downtime statistic.

92

Miscellaneous

Default label

Explanation

Code

Brushed data

Returns "Yes" if current data is partial data from original retrieval. Otherwise, returns "No"..

326

Bypassed samples

Returns the number of bypassed samples for the retrieval.

68

External data

Returns "Yes" if data originates from an external source or a scripted retrieval. Otherwise, it returns "No".

327

Last Note

Returns the note for the most recent record, which may be blank.

73

Last Event

Returns the most recent event, which may be blank.

70

Last Part Number

Returns the name of the last standard for the most recent record.

74

Last Process

Returns the name of the process for the most recent record.

69

Last Sample size

Returns a value for the sample size of the most recent record.

71

Last sum Defects

Returns a value for the number of defects for the most recent record.

72

Windows login name

Returns the Windows login name for the Windows user currently logged in on the workstation.

93

Retrieval name

Returns the name of the Dashboard Retrieval if used or "NA" if no Dashboard Retrieval was used.

94