Calculations for normality of distribution include Skewness, Kurtosis and Chi-squared goodness-of-fit.
The tables for skewness and kurtosis are taken from Quality Control and Industrial Statistics, pp. 956-957. See "References" at the end of this section for more information.
When the values of skewness and kurtosis are tested for normality, the Moments Hypothesis tests are used
If the distribution is normal, there is a strong probability (95% or 99%, depending on how you have configured the program) that the skewness will not exceed the listed value.
|
Samples |
Critical value |
|
25 |
1.073 |
|
30 |
0.985 |
|
35 |
0.932 |
|
40 |
0.869 |
|
45 |
0.825 |
|
50 |
0.787 |
|
60 |
0.723 |
|
70 |
0.673 |
|
80 |
0.631 |
|
90 |
0.596 |
|
100 |
0.567 |
|
125 |
0.508 |
|
150 |
0.464 |
|
175 |
0.430 |
|
200 |
0.403 |
|
250 |
0.360 |
|
300 |
0.329 |
|
400 |
0.285 |
|
500 |
0.255 |
|
750 |
0.208 |
|
1000 |
0.180 |
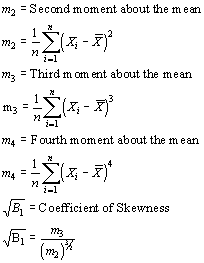
Skewness describes how non-symmetrical the data are on either side of a vertical axis through the mean. Calculations for skewness are as follows:

If the distribution is normal, there is a 99% probability that the kurtosis will not be below the low value or above the high value.
|
Samples |
Low value |
High value |
|
25 |
-1.28 |
2.30 |
|
30 |
-1.21 |
2.21 |
|
40 |
-1.11 |
2.04 |
|
50 |
-1.05 |
1.88 |
|
75 |
-0.92 |
1.59 |
|
100 |
-0.82 |
1.39 |
|
125 |
-0.76 |
1.24 |
|
150 |
-0.71 |
1.13 |
|
200 |
-0.63 |
0.98 |
|
250 |
-0.58 |
0.87 |
|
300 |
-0.54 |
0.79 |
|
500 |
-0.43 |
0.60 |
|
1000 |
-0.32 |
0.41 |
|
2000 |
-0.23 |
0.28 |
|
5000 |
-0.15 |
0.17 |
Kurtosis describes the peakedness of the data. When compared to a normal curve, is the curve for this data higher or flatter? Calculations for kurtosis are as follows:

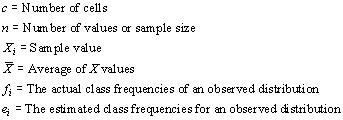
The Chi-squared goodness of fit is used to test the standard deviation for a distribution.

The validity of this statistic is affected by the scaling factors chosen in constructing the histogram.
Assumptions when calculating for normality of distribution:

References:
Beyer, William H. Standard Mathematical Tables, 25th Edition. CRC Press, 1981. p. 507.
Duncan, Acheson J., Quality Control and Industrial Statistics, Fourth Edition. Homewood, IL: R.D. Irwin, 1974.
Geary, R.C. and E.S. Pearson. Biometrika. Biometrika Office, University College, 1938.