 ), R, R-Bar (
The calculations for X-Bar ( ), R, R-Bar (
![]() ) and S are basic to the GainSeeker SPC system. The methods for calculating each depend on the subgroup size of the sample.
) and S are basic to the GainSeeker SPC system. The methods for calculating each depend on the subgroup size of the sample.
Calculating X-Bar and X-double bar
 = the average of the values in a subgroup
![]()
 = the average of the averages
![]()
Calculating R and R-Bar
![]()
![]()
![]() = Average of the ranges
= Average of the ranges
![]()
If the subgroup size is one, ![]() is the average of the Moving Ranges and is calculated as follows:
is the average of the Moving Ranges and is calculated as follows:
R = the absolute value of the difference between successive pairs of measurements
![]()
![]() = Average of the moving ranges
= Average of the moving ranges
![]()
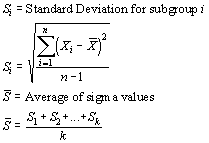
Calculating S and S-Bar

If the subgroup size is one, the formula works like moving range.

Assumptions
![]()
n = total number of observations in a subgroup
k = total number of subgroups
References
Ford Motor Company, Product Quality Office. Continuing Process Control and Process Capability Improvement. 1985. Pages 12, 14.
General Motors Corporation. General Motors Statistical Process Control Manual. August, 1984. Pages 4-3, 4-4.
Grant, Eugene L. and Leavenworth, Richard S. Statistical Quality Control, Fifth Edition. McGraw-Hill Book Company. 1980. Pages 44 - 49.