Short Run statistics
Besides Uncoded retrieval for your data, GainSeeker SPC Short Run provides three methods of coding Short Run data, including Target/Nominal, Range/Short Run, and Standardized.
Why code data?
GainSeeker SPC Short Run provides 3 coding methods for your Short Run data, in addition to Uncoded retrieval. You need to select one of these methods when you set up the process specification
|
Short Run method:
|
Result:
|
|
Target/Nominal
|
This subtracts Target X from the  chart plot point. This method requires all subgroup sizes to be the same size and chart plot point. This method requires all subgroup sizes to be the same size and  values to be similar. values to be similar.
|
|
Range/Short Run
|
This subtracts Target X from the  plot point but also divides the coded plot point but also divides the coded  value by Target R or S. This method requires all subgroup sizes to be the same size. value by Target R or S. This method requires all subgroup sizes to be the same size.
|
|
Standardized
|
This subtracts Target X from the  plot point and divides the coded value by a variance factor. This method is the same as the Short Run method, without the equal subgroup size requirement. plot point and divides the coded value by a variance factor. This method is the same as the Short Run method, without the equal subgroup size requirement.
|
|
Uncoded
|
This method retrieves the data in raw form, exactly as you stored it. (No calculations.)
|
When should I use Target/Nominal method?
Use Target/Nominal method when you are confident your process contains the same amount of variation from part to part. If your parts have different spec values, and the process has about the same accuracy at each spec, this is a good Short Run method. This method does not change Range, Moving Range, or Sigma charts.
For example, a machine shop uses Short Run on one of its drill presses. This press drills one-eighth, one-quarter, and one-half inch holes, depending on the part being produced. From past statistical analysis, they know this particular machine is accurate to plus- or minus-0.020 of an inch, for each size hold being drilled. They decide to use the Target/Nominal data Short Run method.
When should I use Range/Short Run method?
You should use the Range/Short Run method when you are not confident that your process contains the same amount of variation from part to part. If you think your process is more variable for certain part numbers (and you don't want to see this on the chart), use the Range/Short Run method.
The machine shop notices that one-eighth inch holes have a variance of + 0.010, one-quarter inch holes have a variance of + 0.020, and one-half inch holes have a variance of + 0.040. They do not want the Range (MR or Sigma) chart showing an out-of-control condition (indicating a Process shift) due solely to switching to one of these parts. This company chooses the Range/Short Run method. They want to see charts that are not biased by this known and consistently different variance.
When should I use Standardized method?
You should use the Standardized method when you have different subgroup sizes for different part numbers. Besides taking out variations in the Range, the Standardized method also takes out differences in subgroup size, allowing you to put data with different subgroup sizes on the same chart.
The machine shop uses another one of its drill presses in the production of very expensive parts. Since the cost of measuring these parts is much higher, the regular subgroup size would decrease the shop's profits unacceptably. They need to switch to a smaller subgroup size. Then they can use the Standardized method to allow them to chart all pieces from this press on one chart.
Kruskal-Wallis Test for Short Run Retrieval
This test determines if all the Part Numbers being used are from the same population of if they are using the correct coding method. The Kruskal-Wallis ( KW) Test ranks readings of data from largest to smallest and produces a number compared to a Chi-Squared value. Following the Boeing test method, the KW Test passes if the KW value is less than the Chi-Squared value for 0.10. It fails if the KW value is greater than the Chi-Squared value for 0.01. It is uncertain if the KW value falls between the Chi-Squared values for 0.10 and 0.01.
Using process specifications
You may enter specifications for processes in GainSeeker SPC Short Run. When you analyze Short Run data, GainSeeker SPC Short Run checks the specifications for the process and uses them to calculate ProcessCpk. You should notice the difference between ProcessCpk and Cpk. ProcessCpk is just a reference number and has no direct correlation to Cpk. Therefore, ProcessCpk should only be used in comparisons against other ProcessCpk values, never against Cpk for a given data set. ProcessCpk is represented by ~Cpk.
Calculations for Target/Nominal X-Bar and R Charts
The following formulas are used to calculate the Plot Points and the Control Limits for the Target/Nominal  and R Charts. The Control Limit calculations are the same as conventional Control Charts.
Calculating plot points for the control chart

See also: Calculating Control Limits
Calculations for Range/Short Run X-Bar and R Charts
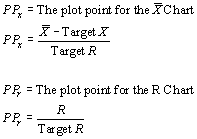
The following formulas are used to calculate the Plot Points and the Control Limits for the Range/Short Run  and R Charts.
Calculating plot points for the control chart

See also: Calculating Control Limits
Calculations for Standardized X-Bar and R Charts
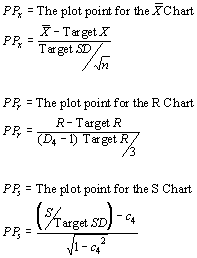
The following formulas are used to calculate the Plot Points and the Control Limits for the Standardized Short Run  and R Charts.
Calculating plot points for the control chart

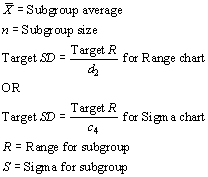
Where:

See also: Calculating Control Limits
![]() chart plot point. This method requires all subgroup sizes to be the same size and
chart plot point. This method requires all subgroup sizes to be the same size and ![]() values to be similar.
values to be similar.![]() plot point but also divides the coded
plot point but also divides the coded ![]() value by Target R or S. This method requires all subgroup sizes to be the same size.
value by Target R or S. This method requires all subgroup sizes to be the same size.![]() plot point and divides the coded value by a variance factor. This method is the same as the Short Run method, without the equal subgroup size requirement.
plot point and divides the coded value by a variance factor. This method is the same as the Short Run method, without the equal subgroup size requirement.


