I suppose by now I shouldn’t be surprised at the creative ways our customers use GainSeeker Suite. I think I’ve been in just about every kind of manufacturing setting you can imagine, from potato chips to silicon chips, from plastic bags to golf balls. And then within this wild diversity, I’ve seen people capture, analyze, and visualize data for product quality, dimensions, scrap, environmental waste, OEE, on time-delivery, and many other applications.
So what happens when you turn your attention to a broader economic indicator? I thought I’d share one of the creative ways I use GainSeeker Suite. I hope it stimulates your thinking.
Over the years, one of the key economic indicators that I like to follow is the Purchasing Manager’s Index (PMI). Published monthly by the Institute of Supply Management, the PMI summarizes the purchasing activities in key business sectors. I’ve found it a pretty reliable indicator of the health of manufacturing in the United States. You can read more about the PMI at Wikipedia. You can also see the raw data, and find links to various reports at the ISM site.
I wanted to see what this data looked like on a control chart, so I made an easy-to-use GainSeeker data collection template to help me do it. (If you’re a GainSeeker user, I’ll be happy to send you the template, just email me at ejmiller at hertzler dot com.)
The template is designed to run from the Charting Module. Did you know about the “Get External Data” function in Charts? (Use File, External Data to tap into this powerful set of features.) Get External Data makes it easy to cut and paste data from a variety of sources so that you can do some quick analysis without saving the data to your production database.
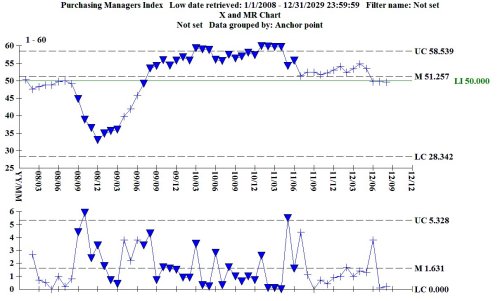
The template links to the current PMI file on the ISM site, and gives you instructions on how to store it to your computer. Then it asks you how far you want to go back in your analysis. For the chart above, I chose to go back to the start of 2008, so you can see how the recession hit in the middle of 2008.
If you’re already familiar with the PMI, you know that the magic number is 50%. Above 50% is an indicator that the manufacture is growing. Below 50% is a sign of contraction. The last three months we’ve hovered just below 50%, so I’m keeping my eye on it. I think we’re seeing some seasonality here as we wind down the year, and as we come into a major (US) election.
What about you? What are the creative ways you’ve used GainSeeker Suite? What features are you tapping into that you think are off the beaten track? And where do you think this economy is going? Use the ShareThis button below to mark this page, leave a comment, schedule a conversation, or call 800-958-2709.

