Stop Being Mislead By Data Taken Out of Context: Adjust Suppliers and Processing to Minimize Cost While Maximizing Quality
All too often, valuable data is locked up in spreadsheets, stand-alone systems, or enterprise databases that require an advanced degree to get to. While GainSeeker’s integration capabilities can eliminate that problem, how does your team make sense of all this data? Sometimes it’s all noise and no signal.
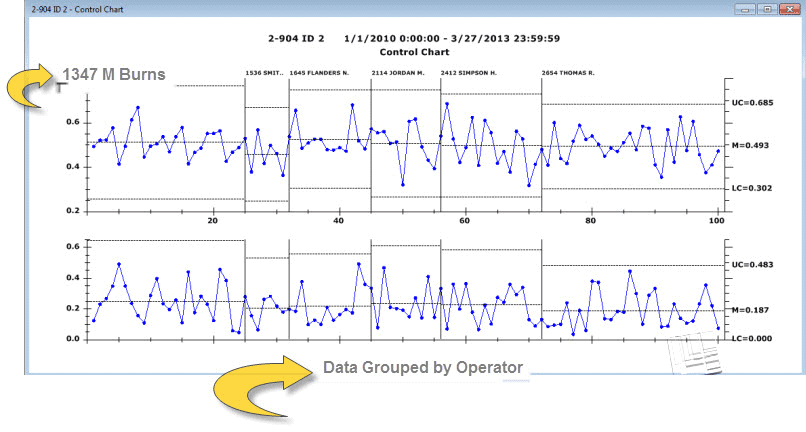
GainSeeker Statistical Process Control Chart grouped by Operator reveals a source of variation.
GainSeeker analysis features give you the tools you need to make the right calls, all built on a foundation in Statistical Process Control:
- X-bar and R control charts
- X and MR control charts
- X / R / MR Control charts
- X-bar and S control charts
- Short Run control charts
- EWMA charts
- CuSum charts
- Trend charts
- Histograms
- CpK, CP, analysis
- Normalacy analysis
- P, nP, C, U charts
- DPU/DPM charts
- Pareto charts
- Box & Whisker charts
- Paired Sample Charts
- Capability
- Performance charts
- OEE Charts
GainSeeker makes it easy to group data and drill down into it to identify significant variations in populations. For example, using GainSeeker analytics, a metals manufacturer reduced scrap by 90%. And a foods manufacturer reduced product giveaway by 70% in six weeks.
By placing the raw data in context, the value goes up and it changes the game.
Wizards do the heavy lifting for you
With GainSeeker wizards, you don’t have to be a master data scientist or a database expert to drive actionable results.
- SPC Variation Wizard – Finds the source of variation within a block of variable (measurement) data set
- Defect Variation Wizard – Finds the source of variation within a block of defect (counts/non-parametric) data set
- Overpack Wizard – Predicts the amount of savings that can be realized by reducing material overfill.
- Big Data Analytics Control – Helps you pinpoint sources of variation among vast amounts of data.
Dashboards make performance visible
GainSeeker Dashboards make performance visible to all stakeholders. This increases accountability and ownership of process improvement.
