GainSeeker allows you to specify several default options for use with the chart builders in the DMS Charts and Reports module. Customizing these default options to suit your needs will make routine analysis and charting activities even faster and more convenient.
Some of these settings are also applied when using the Enterprise Dashboard and Dynamic Reports modules.
To configure default settings for DMS charts, expand the DMS tree.
|
To configure default settings for DMS control charts, expand the Control charts tree.
To choose which limits and lines to display on DMS control charts by default, expand the Control chart limits tree. Then select the check boxes for the lines and limits you want to display by default. Your options include:
Control – If checked, this will display the control limits that have been calculated from the data shown on the chart.
Control center line – If checked, this will display the mean (the midpoint between the upper and lower control limits) that is calculated from the data shown on the chart.
Gate – If checked, this will display the gate limits from the standard for which data is being charted.
Gate center line – If checked, this will display the midpoint between the gate limits from the standard for which data is being charted.
To choose which views will be selected by default on Step 3 of the Control Chart Builder, expand the Default control views tree. Then select the check boxes for the views you want to be selected by default.
For more information on the options available, see Views.
To choose how the y-axis on DMS control charts will be scaled and labeled, expand the Display u and p data as tree. Then choose the scaling option you prefer. Your options include:
DPM/PPM – This option will scale the y-axis to Defects per million (DPM) or Parts per million (PPM) depending on the data type. It is particularly useful if you have a very small number of defects.
Percent – This option will scale the y-axis from 1 to 100 and label it as Percent.
Proportion – This option will scale the y-axis from 0.00 to 1.00 and label it as Proportion.
To configure default settings for DPU charts, expand the DPU charts tree.
To choose which views will be selected by default on Step 3 of the DPU Chart Builder, expand the Default DPU views tree. Then select the check boxes for the views you want to be selected by default.
For more information on the options available, see Views.
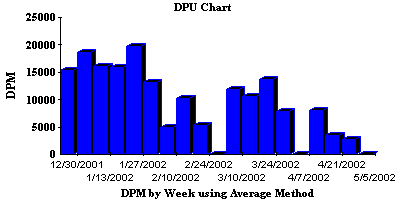
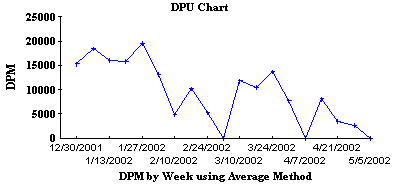
You can choose whether to display DPU and Yield charts as bar charts or as line charts by default.
To display DPU and Yield charts as bar charts by default, select the Display bars for DPU and Yield charts check box.
To display DPU and Yield charts as line charts by default, clear the Display bars for DPU and Yield charts check box.
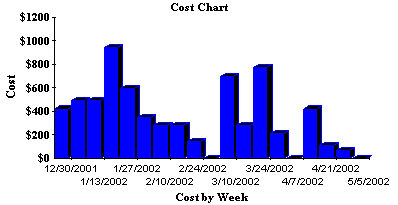
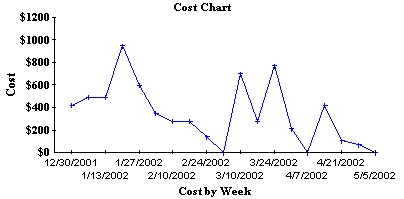
You can choose whether to display DPU Cost charts as bar charts or as line charts by default.
To display DPU Cost charts as bar charts by default, select the Display bars for DPU Cost charts check box.
To display DPU Cost charts as line charts by default, clear the Display bars for DPU Cost charts check box.
When any of the DPU charts is displayed as a bar chart, you can choose whether the value of each bar will be displayed above that bar by default.
To display the value of each bar by default, select the Display values above bars for DPU charts check box.
To hide the value of each bar by clear, select the Display values above bars for DPU charts check box.
When DPU and Yield charts are displayed as line charts, you can choose which limits and lines to display on these charts by default. To do so, expand the DPU chart limits tree. Then select the check boxes for the lines and limits you want to display by default. Your options include:
Control – If checked, this will display the control limits that have been calculated from the data shown on the chart.
Control center line – If checked, this will display the mean (the midpoint between the upper and lower control limits) that is calculated from the data shown on the chart.
The method used to plot data and calculate control limits depends on the type of chart being generated:
A DPU chart will plot data based on the number of defects relative to the total number of units inspected. Thus, control limit calculations for DPU charts are based on u-type data.
A Yield chart will plot data based on the number of defective units relative to the total number of units inspected. Thus, control limit calculations for Yield charts are based on p-type data.
To choose the Group by time interval that will be selected by default on Step 2 of the DPU Chart Builder, expand the Group data for DPU chart by tree. Then click the time period – Day, Month, Quarter or Week – that you want to select by default. (The Week is Sunday through Saturday.)
The amount of data you want to display on the chart over the specified date range will influence the time interval you select when you create the DPU chart. For example, DPU data retrieved over a four-year period would best be displayed by Quarter, whereas data retrieved over a one-month period would best be displayed by Day.
To configure default settings for Pareto charts, expand the Pareto charts tree.
To choose which Views will be selected by default on Step 3 of the Pareto Chart Builder, expand the Default pareto views tree. Then select the check boxes for the views you want to be selected by default.
To choose which Options for Pareto, Pie and Bar will be selected by default on Step 3 of the Pareto Chart Builder, expand the Options for pareto, pie and bar tree. Then select the check boxes for the options you want to be selected by default.
You can choose whether the Show bars with no Defects check box will be selected by default on Step 3 of the Pareto Chart Builder.
If the Show bars with no Defects check box is cleared, then GainSeeker will only display bars for items with defects.
If you also want to show bars for items without defects, select the Show bars with no Defects check box. This setting applies to Pareto charts, Bar charts and Defect Detail windows, but not to Pie charts.
To choose the Sort data for pareto chart bars by category that will be selected by default on Step 3 of the DPU Chart Builder, expand the Sort data for pareto chart bars tree. Then click the Sort data for pareto chart bars by category that you want to select by default.