Grouping data on OEE charts
The Group data for OEE chart by
dialog lets you group data by a specific time period or traceability item
you select for OEE charts. You can also select second-level grouping to
display data grouped by both as bar plots on a single chart. The Group data for OEE chart by dialog
used to select these options, opens from the Group
data for OEE chart by settings.
Introduction to OEE
Navigating to the Group data on OEE chart by settings
In the System Administration
module to set default settings if you have permissions:
Navigate to the Group
data on OEE chart by setting on the Configurations
tab of the System Administration
module following this path:
Configurations | "Configuration
Name" | chart defaults | OEE | OEE Charts | Group data for
OEE chart by =
In the GainSeeker Charts
or Dynamic Reports modules to temporarily override default settings:
Navigate to the Group
data for OEE chart by setting following this path on the Settings tab of the DMS/OEE
Charts or DMS Report Retrieval
Settings dialogs:
Retrieval/Configuration | Group data for OEE
chart by
 Note:
For a Dynamic Report, when you group the data by a traceability for primary
or secondary groupings on OEE charts, you must include that traceability
field in your DataDetail by selecting it on the Columns
tab of the DMS Report Retrieval Settings
dialog.
Note:
For a Dynamic Report, when you group the data by a traceability for primary
or secondary groupings on OEE charts, you must include that traceability
field in your DataDetail by selecting it on the Columns
tab of the DMS Report Retrieval Settings
dialog.
The Group data for OEE chart by dialog
Use the Group data for OEE chart by
dialog to determine how data is grouped on OEE bar charts:
Single grouping of the data set:
by a single time period (month, for example)
by a single traceability (shift, for
example)
First and secondary grouping of the data set:
by two time periods (weeks divided into
days, for example). This example displays a chart with same-colored
bars grouped by week with individual bars labeled by day (Fig.
1).
by two traceabilities (Machine and Shift,
for example). This example displays bars grouped by machine with individual
bars with unique colors to represent each shift (Fig.
2). A color legend also displays on the chart.
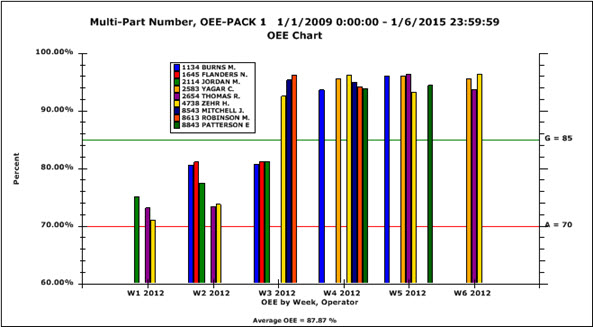
or a combination of a time period and
a traceability (week and operator, for example). This example displays
bars grouped by week with individual bars featuring unique colors
to represent each operator (Fig.
3). A color legend also displays on the chart. Note the spaces
in this example within a week. This indicates that there no data for
some specific operators during that particular week.
Fig. 1
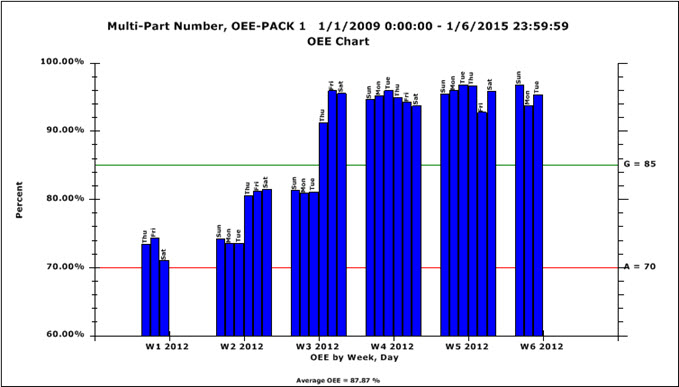
Fig. 2
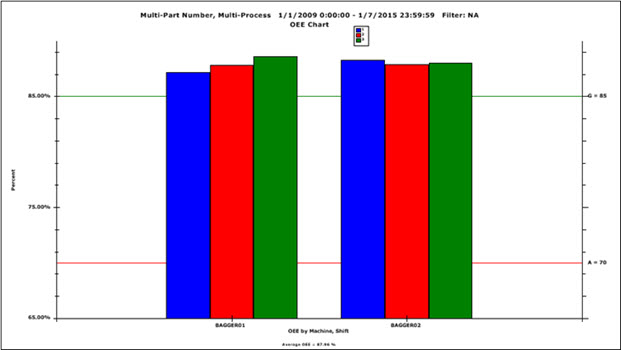
Fig. 3
Selecting
how the data is grouped
You can group data based on dates or times, Day/Shift
(separate group for each combination of Day and Shift), or Traceability.
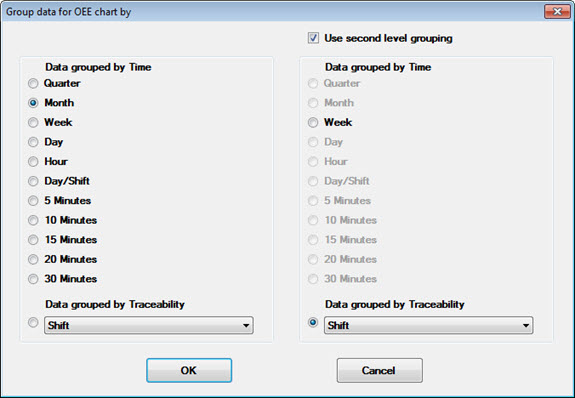
Select the
primary grouping you want using the left panel of the dialog:
- Select an options button for a time increment or select the options
button for a traceability. If you chose to group the data by a traceability,
click the down arrow and select a traceability from the list that
displays.
To optionally group the same
chart data by a secondary grouping:
Select the Use second level
grouping checkbox in the right panel of the dialog.
Then, select an options button for an available time increment
or select the options button for a traceability. (Only time increments
that make sense when paired with your selected time increment for
the primary grouping are shown as available.) If you chose to group
the data by a traceability, click the down arrow and select a traceability
from the list that displays.
Related topics
The Top / Bottom n Values setting
lets you choose whether to display all bars on an OEE chart or only the
top n or lowest n
values. For example, displaying only the top n
values when you track multiple machines can help you quickly identify
your machines with the least problems.