Flow Chart Analysis of Non-Normal Data
Flowchart
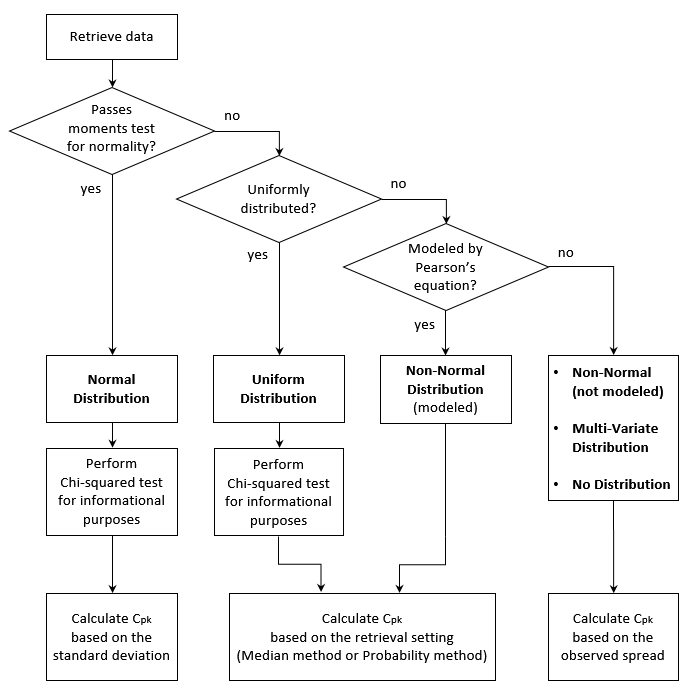
When the retrieval setting for Force distribution is set to Automatic (the default), GainSeeker follows these steps to determine the data distribution and method for statistical calculations:
Uniform distribution and Non-Normal distribution (modeled)
|
|
|
High Spec − Low Spec
|
|
d(U) − d(L)
|
|
|
|
|
d(U) − d(L)
|
|
High Spec − Low Spec
|
|
Mean + 3SD is the point on the x-axis where 0.135% of the data is above the value
Mean − 3SD is the point on the x-axis where 0.135% of the data is below the value
Mean + 4SD is the point on the x-axis where 0.003% of the data is above the value
Mean − 4SD is the point on the x-axis where 0.003% of the data is below the value
Six SD = (Mean + 3SD) − (Mean − 3SD)
Median method for calculating Cpk
The calculations for d(U) and d(L) are described above.
| Zu = |
|
High Spec − Median
|
|
d(U) − Median
|
|
✕ 3 |
| Zl = |
|
Median − Low Spec
|
|
Median − d(L)
|
|
✕ 3 |
Probability method for calculating Cpk
Zu = z value (from the normal distribution table) corresponding to the predicted percent above the high spec
Zl = z value (from the normal distribution table) corresponding to the predicted percent below the low spec
Non-Normal (not modeled)
|
|
|
High Spec − Median
|
|
High Value − Median
|
|
✕ 3 |
|
|
|
Median − Low Spec
|
|
Median − Low Value
|
|
✕ 3 |
|
|
|
High Spec − Low Spec
|
|
High Value − Low Value
|
|
|
|
|
High Value − Low Value
|
|
High Spec − Low Spec
|
|
Mean + 3SD = Mean + (3 ✕ SD)
Mean − 3SD = Mean − (3 ✕ SD)
Mean + 4SD = Mean + (4 ✕ SD)
Mean − 4SD = Mean − (4 ✕ SD)
Six SD = 6 ✕ SD