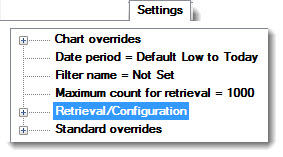
The Retrieval/Configuration node on the Settings tab offers multiple options for changing the GainSeeker default retrieval settings on all SPC chart types, including statistics lists, multiple charts, and data tables. Information about each of these settings is featured in this topic.
|
Contents [Hide] |
You can choose default settings for charts in the GainSeeker System Administration module. See Chart Defaults settings
The Retrieval/Configuration node is located at the top level on the Settings tab:
For help with using tree structures like the one on the Settings tab, see Navigating Tree Structures
Each standard is configured for a particular measurement unit such as inches or kilograms. You can report data and statistics using a different measurement unit. Measurement system conversion does not change any of the data stored in GainSeeker. It only changes the numbers that display when charts and reports are drawn.
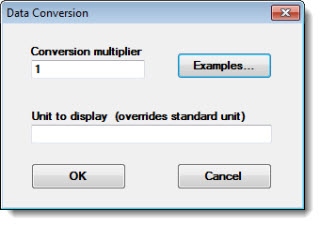
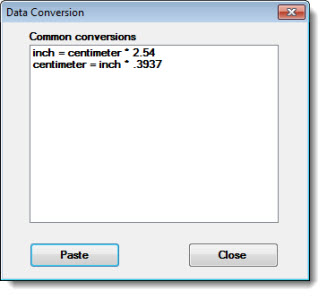
Double-click Conversion multiplier = on the Settings tab to open the Data Conversion dialog.
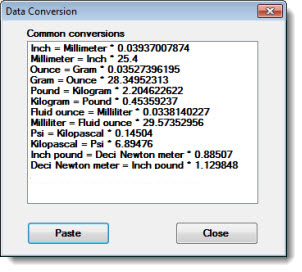
On Data Conversion, click Examples... to view the list of Common conversions.
Click a conversion in the list, and then click Paste. The selection will display on the Data Conversion dialog.
Creating your own conversion multiplier list
You can create your own conversion multiplier list if the current list of Common conversions does not meet your requirements. Note that any new list you create replaces the existing Common conversions list, but you can add any existing conversions to the new list you create.
To get started:
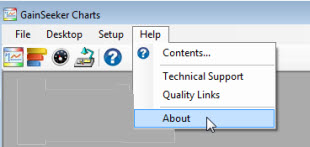
Click the Help menu option on the GainSeeker Charts module
Then, click About in the menu to open About GainSeeker Charts.
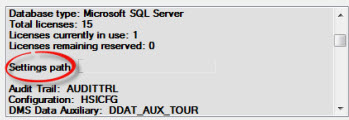
Use the scrollbar on About GainSeeker Charts to locate the path on your computer to the Settings path: (Make note of the path for use in step 4.)
Open Windows Explorer on your computer. Use the path you noted in step 3 to locate the settings folder.
Open the settings folder, and then right-click to display the right-click menu. From the menu, select New. From the submenu that opens, select Text Document.
Name the new file convert.txt and then open the file to edit it.
Enter a new conversion in the convert.txt file using this syntax:
Unit_2 = Unit_1 * number
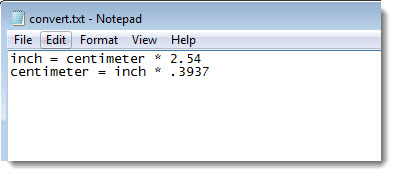
Add any additional conversions you want on a new row using the syntax shown in step 7.
Any conversions listed in the convert.txt file will now display as options in the Common conversions list field.
The acceptance limit is used to calculate the upper and lower CuSum values for each data subgroup. When performing real-time CuSum checks, the upper and lower CuSum values for the data subgroup are checked against the acceptance limit. The acceptance limit can be based on the Upper Ind. Gate, the Upper Gate, or the Upper Spec from the standard for which data is being charted.
This value is used to calculate the upper and lower CuSum value for data subgroups.
This value is used to calculate the upper and lower CuSum value for a data subgroup when that subgroup is the first in the data set retrieved. It is also used in the upper or lower CuSum calculation when the previous CuSum value exceeded the acceptance limit.
More information
For information on the calculations used for CuSum/Control charts, see CuSum statistics.
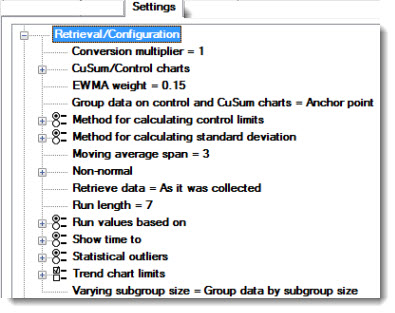
Select the weighting factor for EWMA charts. A typical factor is 0.15 .
To configure this value, double-click EWMA weight, and then enter a numeric value on the Enter Value dialog that opens.
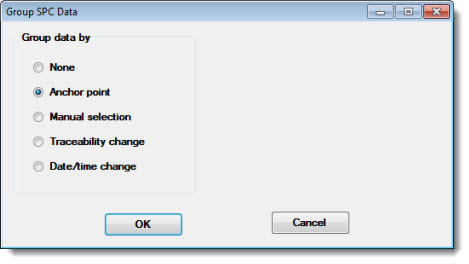
Double-click the Group data on Control and CuSum charts = setting to open the Group SPC Data dialog. See Grouping SPC Data for information about the Group data by options.
Choose a standard deviation method for calculating control limits. The Factors (R-bar / d2) method provides the best prediction if your data exhibits more variation within subgroups than between subgroups. The Sample standard deviation method provides the best prediction if your data exhibits more variation between subgroups than within subgroups.
For information on changing the default setting, see SPC Statistics.
Choose a method for calculating standard deviation for other statistics. The Factors (R-bar / d2) method provides the best prediction if your data exhibits more variation within subgroups than between subgroups, while the Sample standard deviation method provides the best prediction if your data exhibits more variation between subgroups than within subgroups.
The method you choose will be used to calculate the Mean +/- 3SD, Mean +/- 4SD, 6SD, Zl, Zu, and Cpm for data in a normal distribution.
This number represent the number of data points that will be averaged for Moving Average charts.
To configure this value, double-click Moving average span and then enter the a numeric value greater than 1 in the Enter value dialog that opens.
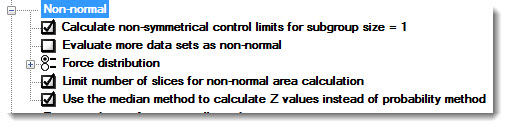
To configure settings for how SPC should work with data that is non-normally distributed, expand the Non-normal node.
The setting options:
Calculate non-symmetrical control limits for subgroup size = 1
GainSeeker can calculate non-symmetrical control limits if the subgroup size is one and the distribution is non-normal, but can be modeled. This option is selected by GainSeeker by default. For more information on non-symmetrical control limits, see Non-symmetrical control limits.
Evaluate more data sets as non-normal
If this option is selected, GainSeeker uses 95% or 99% percent confidence limits to determine normality of data.
Select an option for analyzing the normality of a data distribution:
Automatic. Allows GainSeeker to test the data set for normality. GainSeeker will apply the appropriate statistical analysis to the data set based on whether the distribution is normal or non-normal.
Non-normal. Even if the data is normally distributed, GainSeeker analyzes each data set as a non-normal distribution if this option is selected. This gives the most accurate calculation of the true shape of the curve.
Normal. Even if the data is non-normally distributed, GainSeeker analyzes each data set as a normal distribution. This makes the statistical analysis easy to replicate by hand, but it does not always provide a true representation of your process because the true distribution of the data can be sometimes ignored.
Limit number of slices for non-normal area calculation
You can choose unlimited non-normal slices or limited non-normal slices at 2048. The larger the number of slices, the longer the program will take to calculate non-normal area for unusual distributions. This option is selected by GainSeeker default.
Use the median method to calculate Z values instead of probability method
GainSeeker calculates Z values using the median method instead of the probability method if this option is selected. This option is selected by GainSeeker default.
Double-click Retrieve data = to open the Retrieve Data dialog.
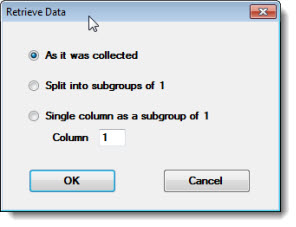
For example, when analyzing 25 data records and each record has a subgroup size of 3, then each subgroup will be broken up into 3 data records with one measurement each. The result will be data analysis for 75 data records with a subgroup size of 1.
For example, if you choose to retrieve the third column when analyzing 100 data subgroups, the result will be data analysis for 100 data points with a subgroup size of 1.
The number of consecutive points needed to identify a run or a trend can be set to 6, 7, or 8. The GainSeeker default setting is 7.
To change this setting, double-click Run length= and enter 6, 7, or 8 in the text box of the Enter Value dialog that opens.
Choose whether to calculate mean and zone based on Control or Gate limits for real-time checks on runs, trends, and zones (points outside 1SD or 2SD).
For information on changing the default setting, see SPC Data Entry.
To set the precision for displaying time stamps, expand Show time to and select an option.
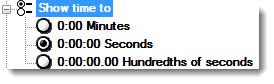
For information on changing the default setting, see Calendar and dates.
 Note:
Changing this setting will not affect Data Tables. To show a different
time precision on Data Tables, you must change the default setting.
Note:
Changing this setting will not affect Data Tables. To show a different
time precision on Data Tables, you must change the default setting.
Expand Statistical outliers and select which data to include. Statistical outliers are observations that violate SPC rules.
If you choose to exclude statistical outliers, the out-of-control data points will be displayed as outliers on control charts and data tables, but will be excluded from the statistical calculations.
All data included. Includes all data points in the statistical calculations.
Data outside Control limits excluded. All data points that fall outside the calculated control limits will be excluded from the statistical calculations.
Out of Control, runs, trends, and zone violations excluded. All data points that fall outside the calculated control limits and all data that violates SPC rules for runs, trends, or zones will be excluded from the statistical calculations
For information on changing the default setting, see SPC Statistics.
 Note about excluding outliers
and occasional oscillation cycle occurrences:
Note about excluding outliers
and occasional oscillation cycle occurrences:
When you choose to exclude outliers, GainSeeker loops through the data at least twice to determine if excluding the outliers will change the control limits to a point that will push other data points outside the new control limits, creating new outliers. Typically, the outlier loop is only executed a few times, however, there are times when the outliers endlessly oscillate in and out of control limits. This can happen when control limits change as data points are excluded/included on subsequent passes through the data set. Thus, GainSeeker is limited to a maximum ten passes when such an oscillation cycle occurs.
If your report includes the statistic "Trend crosses at," which returns the x value where the trend line is expected to cross the closest limit on a trend chart of the retrieved data, that statistic will be affected by the limits selected here.
Control. If selected, the control limits that have been calculated from the retrieved data may affect the "Trend crosses at" statistic.
Control center line. This setting has no effect on the "Trend crosses at" statistic.
Gate. If selected, the gate limits from the standard for which data is retrieved may affect the "Trend crosses at" statistic.
Gate center line. This setting has no effect on the "Trend crosses at" statistic.
Ind. Gate. If selected, the Ind. Gate limits from the standard for which data is retrieved may affect the "Trend crosses at" statistic.
Ind. Gate center line. This setting has no effect on the "Trend crosses at" statistic.
Spec. If selected, the specification limits from the standard for which data is retrieved may affect the "Trend crosses at" statistic.
Spec center line. This setting has no effect on the "Trend crosses at" statistic.
To configure the settings for incomplete subgroups and varying subgroup sizes, double-click Varying subgroup size to open the Incomplete Subgroups and Varying Subgroup Sizes dialog:
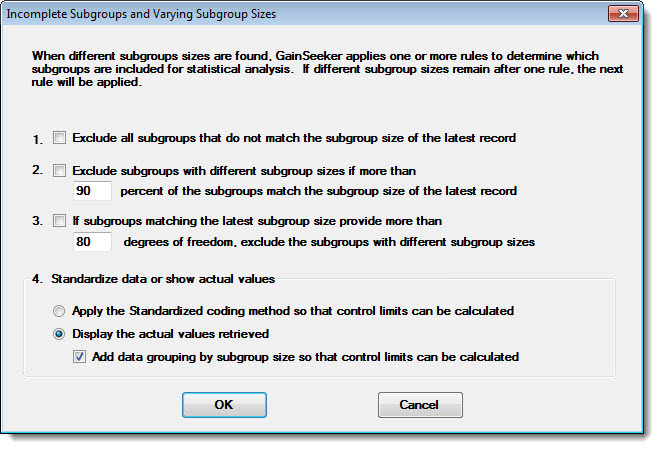
Each time you retrieve data for a standard, GainSeeker will count the number of measurements stored for each subgroup in the retrieval. If you retrieved data with incomplete subgroups or multiple subgroup sizes, the number of measurements per-subgroup will not be identical for all subgroups in the retrieval. GainSeeker will use these settings to determine how statistics will be calculated on this data:
1. Exclude all subgroups that do not match the subgroup size of the latest record. GainSeeker counts the number of measurements stored for the most recent subgroup in the retrieval. Any subgroups that contain a different number of measurements will be displayed on charts and data tables, but temporarily excluded from statistical calculations. (If you select this option, GainSeeker ignores all other settings on this screen and make them unavailable.)
2. Exclude subgroups with different subgroup sizes if more than n percent of the subgroups match the subgroup size of the latest record. GainSeeker counts the number of measurements stored for the most recent subgroup in the retrieval. It then analyzes the percentage of subgroups in the retrieval that contain this number of measurements.
If more than n percent of the subgroups in this retrieval also contain this number of measurements, then any subgroups that do not contain this number of measurements will be displayed on charts and data tables, but temporarily excluded from statistical calculations.
If the number of subgroups in this retrieval is less than or equal to the percentage you specify here, GainSeeker will not use this setting to exclude data from statistical calculations. Instead, it will proceed according to the options you have configured for options 3. and 4. described below.
DFi = Degrees of Freedom for subgroup number i
For a subgroup with n data values (where n > 1): DFi = n - 1
For a subgroup with 1 data value: DFi = 1
For a subgroup with 0 data values: DFi = 0
DF = Degrees of Freedom for the subgroups being analyzed
k = the number of subgroups being analyzed
DF = DF1 + DF2 + ... + DFk
GainSeeker will count the number of measurements stored for the most recent subgroup in the retrieval. It will then calculate the degrees of freedom for subgroups in the retrieval that contain this number of measurements:
If the subgroups containing this number of measurements provide more than n degrees of freedom, any subgroups that do not contain this number of measurements will be displayed on charts and data tables, but temporarily excluded from statistical calculations.
If the subgroups containing this number of measurements do not provide more than n degrees of freedom, GainSeeker will not use this setting to exclude data from statistical calculations. Instead, it will proceed according to the options you have configured for option 4. below.
4. Standardize data or show actual values. Excludes no subgroups from the statistical calculations:
Apply the Standardized coding method. GainSeeker uses the Standardized coding method to display modified data values on charts and uses these modified values to calculate statistics, such as control limits.
Display the actual values retrieved. GainSeeker displays the actual measurements and subgroup averages on charts.
Add data grouping by subgroup size so that control limits can be calculated. Because you are analyzing data with different numbers of measurements in the subgroup without using a coding method to accommodate the difference in subgroup sizes, GainSeeker will not be able to calculate some statistics (such as Cpk or control limits) for the entire retrieval. However, if you select the Add data grouping by subgroup size checkbox, GainSeeker will begin a new data group each time the subgroup size changes. This allows GainSeeker to calculate statistics such as the data mean and control limits separately for each data group.
For information on changing the default setting, see SPC Statistics.