GainSeeker allows you to specify several default options for collecting variable data in modules such as PC Collect, the GS Collect mobile app, and SPC Data Entry.
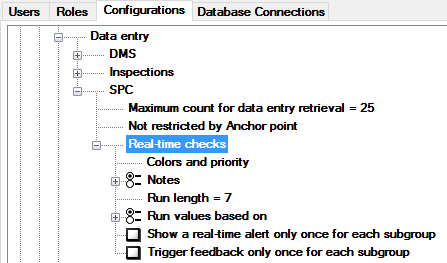
To configure these default settings for variable data entry, expand the SPC tree.
|
Contents [Hide] |
Specify the default maximum number of data points to retrieve when displaying a chart or calculating a real-time failure during a PC Collect inspection.
To change this setting, double-click it and enter a new count.
You can specify whether to use anchor points to restrict the number of historical data subgroups that are retrieved for display on the real-time control chart and for calculating real-time control limits.
To configure the maximum number of anchor points to retrieve:
Right-click the Not restricted by Anchor point node on this tree.
This will display the Data Entry Data screen.
To set the maximum number of anchor points to retrieve for data entry charts and statistics, click the Data goes back list and then click the number of anchor points.
To configure GainSeeker to display all data subgroups – including all anchor points – that conform to the date range and data count you have specified, click the Data goes back list and then click All.
If you set a maximum number of anchor points on the previous step, you can also choose to retrieve data going back one additional anchor point under certain conditions.
To use this feature, set the length of time to check for the last data subgroup entered before the anchor point specified in the previous step.
To configure settings for how SPC performs real-time data checks, expand the Real-time checks tree.
Real-time checks can be color-coded and prioritized.
This can help data entry operators understand how to respond to real-time failures during data entry.
In the PC Collect module, these settings are applied to the individual data input cells, the subgroup container, and the Note window. They can also be applied to chart windows for the sub-inspection.
In the SPC Data Entry module, these settings are applied to the air gage, data points, previous, chart backgrounds and the real-time failure note.
These color settings can also help process owners respond quickly to the most critical failures on chart windows, data tables and multiple data tables, Monitor Tables, Dashboard Grid controls, legacy real-time failure dashboards, and legacy SPC Database Monitor windows.
If two failures of different colors apply to one real-time failure note for a data entry subgroup, one cell on a dashboard or multiple data table, or one row on an SPC data table or SPC Database Monitor window, then the color of the higher priority failure will be used to display the item in question.
To set the colors and priority for real-time checks, right-click the Colors and priority node on this tree. This will display the Real-Time Colors screen.
To change the color of a real-time failure or the color used when no failure occurs:
Click the item for which you want to change the color.
Click Change Color. This will display the Color screen.
Click the color to use for the item you highlighted, and then click OK.
The real-time failures listed on the Real-Time Colors screen – everything but Color used when no failure occurs – are listed in order of priority.
To change the relative priority of these real-time failure colors, click one of these failures and then click the Top, Up, Down or Bottom button to move the highlighted failure on the list.
|
When a data point violates a real-time check, GainSeeker will generate a note describing the failure and attach the note to the data record.
To configure whether GainSeeker stores this note, and whether or not this failure note is displayed to the data entry operator, expand the Notes tree and then click one of these options:
If you want to store a note without displaying it, choose Automatically store. This is recommended for automated data entry situations where an operator would not be present to respond to a displayed note.
If you want to display the note without editing or storing it, choose Display only.
If you want to edit a note before storing it, choose Edit note. This is the recommended option for data entry processes that are run and monitored by human operators.
The number of consecutive points needed to identify a run or a trend can be set to 6, 7 or 8.
To change this setting, right-click the Run length node of this tree and enter the number of points you wish to use for runs and trends.
On a range chart, GainSeeker anticipates that more values will plot below the R-bar than above it. These counts are automatically adjusted based on subgroup size. The following lengths are used:
Subgroup size of 1 or 2:
Above the mean:
The number of points in a run that plot above the R-bar = run length (as set in the System Administration module) - 1 (=7 if configuration is set to 8)
Below the mean:
The number of points in a run that plot below R-bar = run length (as set in the System Administration module) + 2 (= 10 if configuration is set to 8)
Subgroup size larger than 2:
Above the mean:
The number of points in a run above R-bar = run length (as set in the System Administration module) (= 8 if configuration is set to 8)
Below the mean:
The number of points in a run below R-bar = run length (from Administration + 1 (= 9 if configuration is set to 8)
For real-time checks on runs, trends and zones (points outside 1 SD or 2 SD), you can choose whether you want mean and zone calculations to be based on control limits or gate limits.
To change this setting, expand the Run values based on tree and then click Control or Gate.
To display all the real-time failure notes after entering all the data points for the subgroup, select this check box.
To display the real-time failure note each time an individual measurement or the entire subgroup fails a real-time check, clear this check box. When this check box is cleared, the failure note screen may be displayed several times as you enter data for one data subgroup (if you have more than one individual or subgroup failure).
To execute Feedback commands in the data entry template only after all the data points for the subgroup have been entered, select this check box.
To execute Feedback commands each time an individual measurement or the entire subgroup fails a real-time check, clear this check box. When this check box is cleared, some Feedback commands may be executed several times as you enter data for one data subgroup (if you have more than one individual or subgroup failure).
