After selecting a script in the Python Script Editor, you can use toolbar buttons to run the debugger.
|
Contents [Hide] |
Use any of these methods to begin debugging:
In the GainSeeker Inspections module, use Manage Inspections to edit the Inspection. Double-click any Formula test with a Python script selected.
In the GainSeeker Inspections module, use Manage Inspections to edit the Inspection. Right-click on the Inspection Editor window and then click Debug (PC).
In the GainSeeker Inspections module, open the list of Inspections or the list of Planned Inspections. Select the Inspection or Planned Inspection you wish to debug, select the Debug check box, and then click the Run button.
When the Python Script Editor is displayed, click any code-only scripts that may be executed by the inspection and insert breakpoints where desired. For Action-based scripts in an inspection, it is not possible to insert breakpoints.
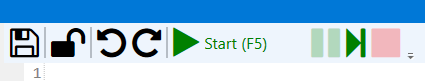
From any script in the Python Script Editor, click the Start button  (or press F5) or the Step button
  (or press F8).
If debugging an Action-based script, use the Step button (because breakpoints are not available).
The debugger will launch the Inspection, and Python scripts will be triggered by Formula tests in the Inspection.
If stopping at breakpoints or stepping through the code, the Python Script Editor will be displayed, and you can use the buttons and tools described below.
You can insert breakpoints to pause the debugger before it executes certain lines of code.
You can add and remove breakpoints before you launch the debugger and any time the debugger is paused.
To insert a breakpoint, click in the area to the left of the line number. You cannot insert a breakpoint on an empty line.
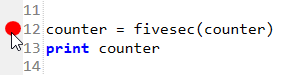
To clear a breakpoint, click it.
There are two ways to run the debugger:
To execute all of the script from the beginning until the first breakpoint is found (if any) or until the end of the script is reached, click the Start button or press the F5 key.
When the debugger is running but paused, this button changes to  . If triggered, the debugger will continue running from its current position in the code until the next breakpoint is found (if any) or until the end of the script is reached.
To step through the code one line at a time, click the Step button or press the F8 key.
 Note: When you first launch the debugger for a script, it begins code execution from the top of the script.
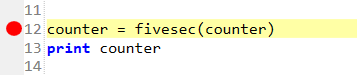
When the debugger is paused - either because of a breakpoint or because you are stepping through the code line by line - the debugger stops before the highlighted line of code is executed. At this point you can click the Start button to continue running the script, click the Step button to execute the highlighted line of code, or execute additional Python commands.
While the debugger is running, new panels display a console window and Local Variables.
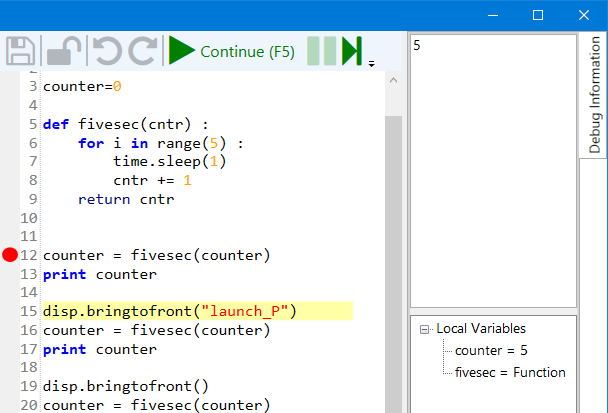
Values that you print to console are displayed in the upper panel. You can edit or delete text in this panel. To jump to the start or the end of the panel's contents, click the panel and then press Ctrl+Home or Ctrl+End.
Values of Python variables, lists, and dictionaries are displayed in the lower panel.
While the debugger is running, you cannot change the code in the script.
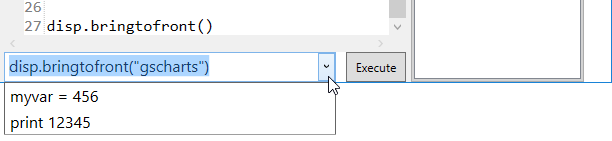
However, you can enter ad-hoc Python commands for the debugger to execute. To do so, type a command in the box at the bottom of the debugger and then click Execute. You can also click the arrow button to select a previously-entered command.
To pause a running script, click the Pause button  . At this point you can click the Start button to continue running the script, click the Step button to execute the highlighted line of code, or execute additional Python commands.
To stop debugging the script, click the Stop button  or press the Esc key.