 Note: Defaults reports settings and all other settings in the Chart overrides node on the Settings dialog can be saved as a chart skin. See Chart Skins for more information.
Use the Default Reports options on the Settings tab to temporarily override default settings for statistics and other information to display with a chart.
You can also assign defaults for these settings in the GainSeeker System Administration module.
Note: Defaults reports settings and all other settings in the Chart overrides node on the Settings dialog can be saved as a chart skin. See Chart Skins for more information.
|
Contents [Hide] |
To navigate to the Default Reports node (setting availability may vary according to the retrieval type):
Chart overrides | Charts | Default reports
Configurations | "CONFIGURATION NAME" | Chart defaults | DMS | Default reports
Right-click a setting to select options.
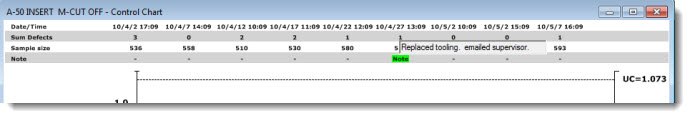
Select information to display on a grid header.
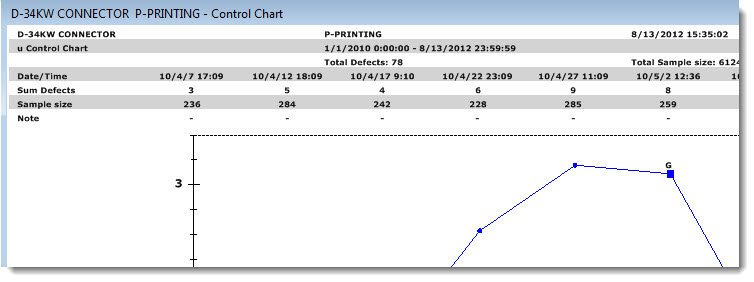
Display multiple statistics and traceability values on a grid above a chart, including one-click, info-tips for Notes at individual data points as shown in this example.
Add or change the statistics for columns on a Control detail table
Add or change the columns in a Data table.
Add or change the statistics for columns on a DPU detail table
Add or change the statistics for columns on a Pareto detail table
Select the statistics list report for a Statistics List
Select the statistics table report for a Statistics Table
Select statistics to display beneath a Control chart or Control detail table on your computer screen and on a printed chart.
Select statistics to display beneath a Data Table on your computer screen and on a printed chart.
You can also opt to print a chart without the statistics. See Printing a chart without the statistics
Select statistics to display beneath a DPU chart or DPU Detail table on your computer screen and on a printed chart.
You can also opt to print a chart without the statistics. See Printing a chart without the statistics
Select statistics to display beneath a Pareto chart or Pareto Detail table, on your computer screen and on a printed chart.