 Fig. 2
GainSeeker uses specific colors for summary/combined charts, DPU charts with second-level grouping, and Pareto chart drill down functions to help you discern between the data sets that display on a chart. GainSeeker's color cycle use can also help you keep track of some progressive functions you perform. Without this feature, it might be difficult to distinguish one data set from another on a Combined chart that has eight data sets, for example. The OEE Combined chart and SPC Combined chart (Fig. 1) are examples of summary charts that are designed to display multiple data sets.
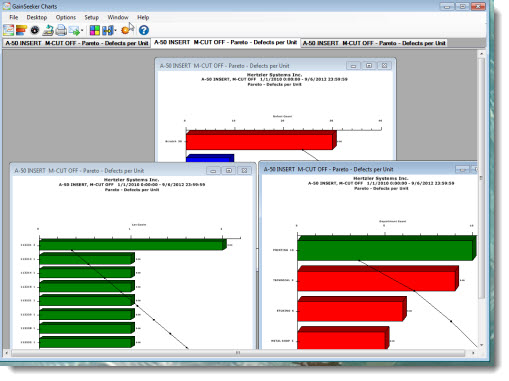
Color assignment is also used when you drill down on a Pareto chart bar. It can help you keep track of which Pareto bar you drilled down on to render the current chart (Fig. 2).
|
Contents [Hide] |
Fig. 1 Fig. 2
GainSeeker uses a specific order of colors for each successive action, such as a drill down on a Pareto chart or for each data set that is selected for a Combined-data chart. The following table displays the color cycle order that GainSeeker uses by default, which you can easily change.
|
Level |
Color |
Example |
|
1 |
Blue |
|
|
2 |
Red |
|
|
3 |
Green |
|
|
4 |
Orange |
|
|
5 |
Dark Magenta |
|
|
6 |
Gold |
|
|
7 |
Navy |
|
|
8 |
Orange-Red |
|
|
9 |
Dark Green |
|
|
10 |
Tomato |
|
|
11 |
Medium Slate Blue |
|
|
12 |
Yellow |
|
|
13 |
Dark Turquoise |
|
|
14 |
Dark Red |
|
|
15 |
Lime |
|
|
16 |
Chocolate |
|
|
17 |
Fuchsia |
|
|
18 |
Olive |
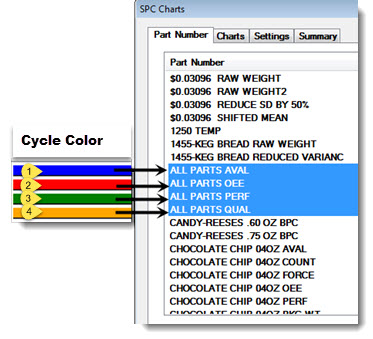
GainSeeker assigns the colors in the order of the standards selected for a Combined Control chart retrieval on the Part Number tab. The cycle color for each part number corresponds to the table above, in this example.
Fig. 3

You can change the order of color succession that GainSeeker uses.
If you change the Bar Color setting (for Pareto and DPU Charts in DMS) or the Line Color setting (Combined Charts in SPC) on the Settings tab, the color succession changes. For example, using the table above as an example, if you change the Bar Color setting to the Level 12 color in the table, and draw a Pareto chart, the bars on this chart are the Level 12 color. If you drill down on a bar of that chart, the chart rendered from that action displays the Level 13 color. As long as you continue to drill down on a bar in the newest chart, the color succession continues: Level 14, 15, 16 ... and so forth until you close that chart.
If you choose a color for the Bar Color or Line Color setting that is not in the list of available colors you have set for you system, GainSeeker mathematically determines the closest color to the one that you have selected (that does not conflict with the background color) and begins the succession of colors from there.
Also see Using Colors for OEE charts