You can use a simple technique called "data brushing" to select data points on a chart. Then, select from options that allow you to focus on just that data or to exclude it from the retrieval.
|
Contents [Hide] |
Note: Data brushing is not available on a Moving Average chart, or on a DPU chart with second-level grouping.
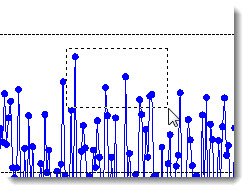
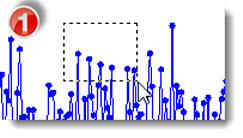
To brush data, click a point on the chart and drag a selection rectangle to include the data points you want.
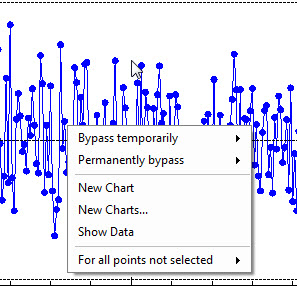
When you release, a list of options display:
Pause over options followed by an arrow ![]() to display a secondary list of options. Then, click an option to select it,
to display a secondary list of options. Then, click an option to select it,
-or-
Click the New Chart, New Charts..., or Show Data option.
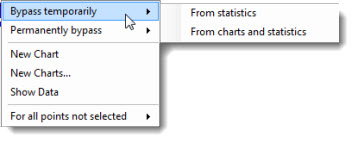
Bypass temporarily![]() From statistics
From statistics
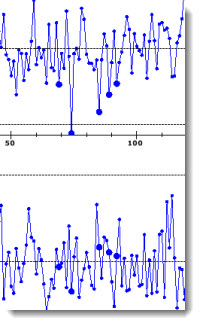
The selected data points are temporarily bypassed on the statistics, but are still shown on chart. The bypassed points display distinctive markers, which can be changed to other marker types. See Markers for more information.
Bypass temporarily![]() From statistics and charts
From statistics and charts
The selected data points are temporarily bypassed on the statistics and the chart. The chart redraws and displays the data without the selected points.
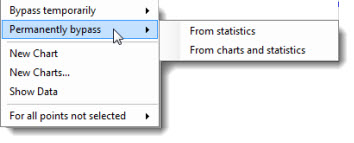
Permanently bypass ![]() From statistics
From statistics
The selected data points are permanently bypassed on the statistics, but are still shown on the chart.
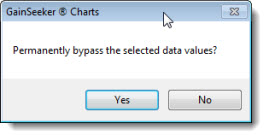
Click Yes to confirm the permanent bypass of the selected data. The bypassed data points will display distinctive markers, which can be changed to other marker types. See Markers for more information.
Permanently bypass![]() From statistics and charts
From statistics and charts
The selected data points are permanently bypassed from the statistics and the chart. The chart redraws and displays the data without the selected points.
Click Yes to confirm the permanent bypass of the selected data.
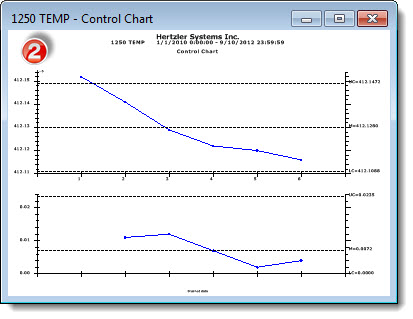
You can create a new chart that displays only the selected data when New Chart is selected.
You can also brush the data on the new chart if you want to focus on even fewer points. Or, you can select from multiple other options using the right-click menu
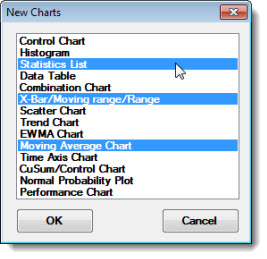
Create one or more charts of different types with the selected data. The options will vary for SPC and DMS retrievals.
The New Charts dialog opens when this option is selected.
Click a chart type on the list to select it.
To select one or more chart types, click a chart name on the list. Then, press the Ctrl ("Control") key as you continue to click additional chart names.
Draws a data table that displays only records for the selected data points.
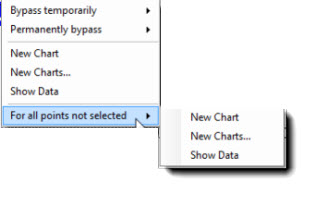
For all points not selected![]() New Chart
New Chart
Redraws the chart, but with the selected data points excluded.
For all points not selected![]() New Charts...
New Charts...
Create one or more different type charts that exclude the selected data. The options will vary for SPC and DMS retrievals.
The New Charts dialog opens when this option is selected.
Click a chart name on the list to select it.
To select one or more chart types, click a chart name on the list. Then, press the Ctrl ("Control") key as you continue to click additional chart names.
For all points not selected![]() Show Data
Show Data
Displays the data records behind the chart except those for the selected data points.