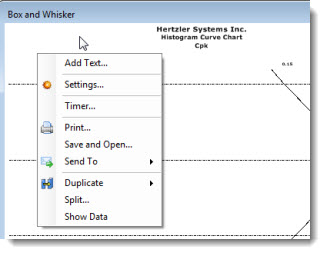
When a chart is open on the GainSeeker charts window, several options are available on the:
Right-click menu for each chart, and/or the
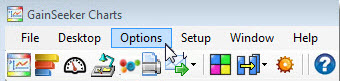
Options menu on the GainSeeker Charts window menu.
Some of these options may be available on both menus.
|
Contents [Hide] |
For information about the Options menu for dashboards: see Design Dashboard... and Timer...
 The available menu options may vary between chart and retrieval types.
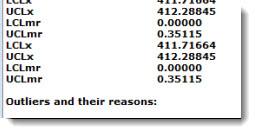
On an SPC Statistics List, adds detailed information about excluded outliers:
Add text or arrows to a chart before sending, saving, or printing it.
Specify which columns display on a Data Table.
Delete a single record (row) from the GainSeeker database using a Data Table. Depending on how your GainSeeker program is configured, you may need certain access rights to use this function
Delete multiple data records from the GainSeeker database using a Data Table. Depending on how your GainSeeker program is configured, you may need certain access rights to use this function.
Opens a dialog with options for designing or opening dashboards.
DPU charts only. This right-click menu option opens the Select DPU start data and value dialog where you can set the improvement start date and start value for a process in a list of defined processes.
You can generate a DPU chart for a bar on the Pareto chart by right-clicking the desired bar.
You can drill down multiple levels to discover the root cause of a defect on a Pareto Chart.
Create a new chart using data from an existing chart (or create a chart from a Data Table). You can add several chart types with the same data to the GainSeeker Charts window.
Edit the Data, Traceability, and Note and Corrective Action items for a data record on a Data Table or Control Chart. Depending on how your GainSeeker program is configured, you may need certain access rights to use this function.
For an SPC chart, see: Editing SPC data and the traceability
For a DMS chart, see: Editing Defect data and the traceability
Edit the Note and Corrective Action for a row on a Control chart or a Data Table. Depending on how your GainSeeker program is configured, you may need certain access rights to use this function.
For an SPC chart, see Editing the note, corrective action, anchor point, or bypass
For a DMS charts, see Editing the Defect note, corrective action, anchor point, or bypass
Search for specific text or values in a Data Table.
Group data into multiple smaller groups of the original retrieval to drill down into data and search for variability. Data groups calculate control limits and you can generate new charts for each group of data.
Display some, all, or no labels for specific data groups.
Performance charts only. See Displaying Labels for Data Groups
Opens a legend that indicates which colors, symbols, letters, or markers (if any) are assigned for specific occurrences on the current chart.
Generate a chart for an individual data group on a chart that has multiple data groups. This allows you to focus on the data for just that group.
Generate one or more charts for specific data groups on a chart containing multiple data groups. This allows you to focus on the data for just those groups.
The GainSeeker Overpack Wizard is a useful tool for helping to determine if overpack levels in your processes could safely be reduced. A shift in process or reduction in variation could minimize the overpack in your process, saving a substantial amount of money over time.
The Overpack Wizard is only available when a Histogram chart is open on the GainSeeker Charts window.
Allows you to draw a Pareto chart from an SPC Data Table record.
Returns you to the previous Drill-down Wizard session for the previous chart.
Returns you to the previous Variation Wizard session for the previous chart.
Select a printer, printing properties, and print the document.
Takes a screen capture (or "snapshot") image of the chart. The file automatically opens after you save it as a file.
Change the way that data points are plotted relative to the Y-axis of the chart.
Sends a copy of the chart, dashboard, or desktop window image or display values (text only) to a program or application you select, or you can save it as a file. You can also send an image of a chart or dashboard (or data text file for lists and tables) to a PowerPoint presentation slide
See Send To options
Change the retrieval, display, and multiple other settings for charts using the Settings tab.
Displays the data behind a chart for a data point. The Data Table for that chart opens with the data record of that point highlighted.
You can generate new charts that analyze only the retrievals you choose from a summary chart that has multiple retrievals in one window.
Opens the GainSeeker Drill-Down Wizard where you can drill-down into defect data to discover the root causes of variation. The Drill-Down Wizard is accessible from a Pareto chart.
Opens the GainSeeker Variation Wizard where you can find sources of variation in your data and use that knowledge to improve your system.
The Variation Wizard is accessible from these SPC chart types: Control, Combination, X-Bar/Moving range/Range, Scatter, and Cusum/Control.
Select a statistics list to display beneath SPC and DMS single and multiple charts.
See Using select statistics dialogs for usage information.
Set a timer to automatically refresh open charts at a time interval you choose.