 The Paired Sample Grid dashboard
control can look for relationships among multiple SPC datasets.
The Paired Sample Grid dashboard
control can look for relationships among multiple SPC datasets.
The Paired Sample Grid dashboard
control can look for relationships among multiple SPC datasets.

Whereas GainSeeker's Paired Sample Analysis analyzes the relationship between two specific SPC datasets with one traceability grouping, this dashboard control retrieves all SPC datasets that meet the criteria you specify and uses all count groupings and traceability groupings you specify to analyze all potential combinations and report those pairs with the highest probability of correlation. (Short Run data analysis is not available on the Paired Sample gird.)
The Paired Sample Grid can analyze data that is grouped by Count or by Traceability. You can also configure the Dashboard Grid control to try both grouping methods.
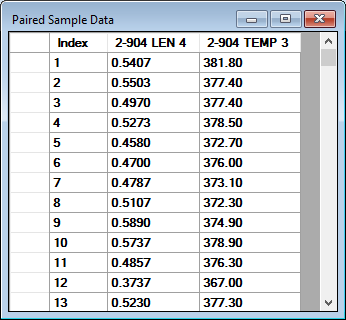
When grouping data by Count, GainSeeker retrieves two datasets and pairs the first (oldest) data record from both datasets, the second record from both datasets, etc., until one or both datasets runs out of data records to match. (Any bypassed data records are removed from the datasets before data records are matched.)
These data pairs are used to calculate a Correlation Coefficient that indicates the strength of the correlation between the two datasets.
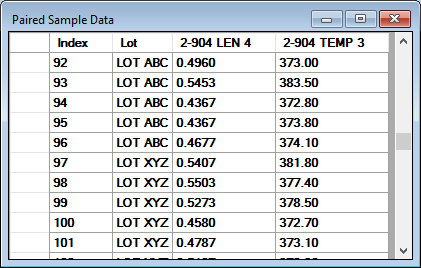
When grouping data by a traceability field, GainSeeker will group the data records for each dataset by the traceability field you specify.
For the first value found in this traceability field (e.g., Serial Number 00001), GainSeeker will pair the first (oldest) data record from both datasets, the second record from both datasets, etc., until one or both datasets runs out of data records to match for that traceability value. This is repeated for all the other values found in that traceability field.
These data pairs are used to calculate a Correlation Coefficient that indicates the strength of the correlation between the two datasets.
When the Correlation Coefficient is close to 0, this indicates that there is no correlation between the two variables.
When the Correlation Coefficient is close to -1, this indicates an inverse correlation between the two variables - as one gets larger, the other gets smaller.
When the Correlation Coefficient is close to 1, this indicates a direct correlation between the two variables - as one gets larger, the other gets larger.
From a dashboard that is open in design/edit mode, click the Paired Sample Grid button:

The Paired Sample Grid control is placed on the dashboard, and the Properties panel displays the properties for this control.

When the dashboard is open in design/edit mode, you can select, move, or resize the Paired Sample Grid control.
To select a Paired Sample Grid control that has been added to a dashboard, click the text area at the top of the control. Alternately, you may use the Properties panel to select the Paired Sample Grid control.

To move the control, use that same text area at the top of the control to click and drag the control to a new location. Alternately, you may use the Properties panel to edit the Location properties of the control.
To resize the control, select the control and then drag the perimeter handles. Alternately, you may use the Properties panel to edit the Size properties of the control.
For instructions on using the Properties panel, see Changing the dashboard and control properties.
Editing this property will display the Select Traceability window:

Select one or more methods for grouping data. (You can use CTRL + click to select multiple values.)
For more information, see Grouping by Count and Grouping by Traceability.
The Paired Sample Grid displays only those dataset comparisons with the strongest correlations.
You can use this property to set the minimum Correlation Coefficient displayed on the Paired Sample Grid. This is an absolute value, so a MinimumCorrelation of 7 would display Correlation Coefficients of 7 and higher as well as Correlation Coefficients of -7 and lower.
Minimum number of matched data pairs that is acceptable for analysis on a row of the Paired Sample Grid.
Limits the data retrieved for analysis, based on the Date/Time stamps of the data records. Narrowing the date range can significantly shorten retrieval time.
For information on choosing date periods, see Setting the Date Periods.
Limits the data retrieved for analysis, based on filter criteria you specify.
This is where you can filter for specific SPC standards, traceability values, or both. Filtering for desired values can significantly shorten retrieval time.
For more information, see Working with Filters.
Limit for the number of data records to retrieve for each SPC standard. Applying this limit can significantly shorten retrieval time.
If the number of data records that meet the Filter and DatePeriod criteria is greater than this limit (n), GainSeeker will only analyze the n most recent records.
If set to 0, this will apply the default Maximum count for retrieval.
You can use this property to set the row colors based on the value of the Correlation Coefficient.
For more information on setting region colors, see Setting the color regions.
For information on other properties for the Paired Sample Grid control, see Common dashboard control properties.
When the Paired Sample Grid control is displayed, you can:
click a column header to sort the rows based on that column
click a row and then click the Paired Sample button to open a Paired Sample chart of that data
right-click a row and then click View
data to see the data pairs analyzed for that row
For more options, see Using the right-click menus for dashboard controls and Opening, viewing, and changing dashboard windows.