
When you first create a new SPC report or a new SPC retrieval in a Mixed report, GainSeeker will automatically apply the following settings:
The default date period for SPC charts and reports
no filter
no maximum count of data records to retrieve for each standard
default retrieval and configuration settings
settings in each standard you selected for the report or retrieval (subgroup size, specification limits, etc.)
To apply different retrieval or statistical settings for this report or retrieval, click the Settings tab:
When you change one of these settings to an option that is different from the default, that setting will be displayed in blue.
|
Contents [Hide] |
To apply a different date period to the data retrieved, or to choose multiple date periods for analysis, right-click the Date period node of the tree. For more information, see Setting the Date Period(s).
If you choose multiple date periods, you may want to review the Summary tab.
To apply one or more filters to the data being retrieved, right-click the Filter name node of the tree. For more information, see Setting the Filter(s).
If you choose multiple filters, you may want to review the Summary tab.
To set an upper limit on the number of data records to retrieve for each standard you selected, right-click the Maximum count for retrieval node of the tree and enter the maximum number of records to analyze for each standard. To remove the maximum count, set this number to 0.
To use retrieval and statistical settings that are different from the default settings, expand the Retrieval/Configuration tree and change the desired settings.
To view or change these settings, expand the CuSum/Control charts tree.
For more details on the calculations used for CuSum/Control charts, see CuSum statistics.
For information on changing the default settings, see SPC Chart defaults.
The Acceptance limit is used to calculate the upper and lower CuSum values for each data subgroup. When performing real-time CuSum checks, the upper and lower CuSum values for the data subgroup are checked against the Acceptance limit. The Acceptance limit can be based on the Upper Ind. Gate, the Upper Gate, or the Upper Spec from the standard for which data is being charted.
To select the limit from which the Acceptance limit will be calculated, expand the Acceptance limit based on tree. Then click Upper Gate, Upper Ind. Gate or Upper Spec.
This value is used to calculate the upper and lower CuSum value for data subgroups.
To configure this value, right-click the Decision interval value node on the tree, and then enter the desired value. The Decision interval value must be greater than 0 but no greater than 10.
This value is used to calculate the upper and lower CuSum value for a data subgroup when that subgroup is the first in the data set retrieved. It is also used in the upper or lower CuSum calculation when the previous CuSum value exceeded the Acceptance limit.
To configure this value, right-click the Start value constant node on the tree, and then enter the desired value. The minimum Start value constant is 0, and the maximum is 1.
This is the weighting factor for EWMA charts. A typical factor is 0.1.
To configure this value, right-click the EWMA weight node on the tree, and then enter the desired value.
For information on changing the default setting, see SPC Chart defaults.
Choose a standard deviation method for calculating control limits. You can choose either Factors (R-Bar / d2) or Sample standard deviation. The Factors method provides the best prediction if your data exhibits more variation within subgroups than between subgroups, while the Sample standard deviation method provides the best prediction if your data exhibits more variation between subgroups than within subgroups.
To view or change this setting, expand the Method for calculating control limits tree.
For information on changing the default setting, see SPC Statistics.
Choose a method for calculating standard deviation for other statistics. You can choose either Factors (R-Bar / d2) or Sample standard deviation. The Factors method provides the best prediction if your data exhibits more variation within subgroups than between subgroups, while the Sample standard deviation method provides the best prediction if your data exhibits more variation between subgroups than within subgroups.
The method you choose will be used to calculate the Mean +/- 3SD, Mean +/- 4SD, 6SD, Zl, Zu, and Cpm for data in a normal distribution.
To view or change this setting, expand the Method for calculating standard deviation tree.
For information on changing the default setting, see SPC Statistics.
This is the number of data points that will be averaged for Moving Average charts.
To configure this value, right-click the Moving average span node on the tree, and then enter the desired value.
For information on changing the default setting, see SPC Chart defaults.
To configure settings for how SPC should work with data that is non-normally distributed, expand the Non-normal tree.
For information on changing the default settings, see SPC Statistics.
GainSeeker can calculate non-symmetrical control limits if the subgroup size is one and the distribution is non-normal but can be modeled. For more information on non-symmetrical control limits, see Non-symmetrical control limits.
Select whether to use a 95% confidence level or a 99% confidence level when analyzing non-normal data. At 95% confidence level, the program treats more data as non-normal than the default of 99%.
To view or change this setting, expand the Force distribution tree. Then select an option for analyzing the normality of a data distribution:
Automatic - This allows GainSeeker to test the data set for normality. GainSeeker will apply the appropriate statistical analysis to the data set, based on whether its distribution is normal or non-normal.
Non-normal - This forces GainSeeker to analyze each data set as a non-normal distribution, even if the data is in fact normally distributed. This gives the most accurate calculation of the true shape of the curve.
Normal - This forces GainSeeker to analyze each data set as a normal distribution, even if the data is in fact non-normally distributed. This makes the statistical analysis easy to replicate by hand, but it does not always provide a true representation of your process because you ignore the true distribution of the data.
You can choose unlimited non-normal slices or limited non-normal slices at 2048. The larger the number of slices, the longer the program will take in attempting to calculate Non-normal area for unusual distributions.
You can choose to have the program calculate Z values from the Median or from a table (Probability method).
To change this setting, right-click the Retrieve data node on the tree and select one of the following options:
To analyze data with the subgroup size that was used when each data record was stored, click As it was collected (the default setting).
To analyze data stored in subgroups as if it were individuals data (data with a subgroup size of 1), click Split into subgroups of 1.
For example, if you select this option when analyzing 25 data records where each record has a subgroup size of 3, then each subgroup will be broken up into 3 data records with one measurement each. The result will be data analysis for 75 data records with a subgroup size of 1.
To sample measurements from within each subgroup – e.g., only the first measurement in each subgroup, only the second measurement in each subgroup, etc. – click Single column as a subgroup of 1 and choose which Column you want to analyze.
For example, if you choose to retrieve the 3rd column when analyzing 100 data subgroups, the result will be data analysis for 100 data points with a subgroup size of 1.
Click OK to apply your changes, or click Cancel to exit this screen without applying your changes.
The number of consecutive points needed to identify a run or a trend can be set to 6, 7 or 8.
To change this setting, right-click the Run length node of this tree and enter the number of points you wish to use for runs and trends.
For information on changing the default setting, see SPC Data Entry.
For real-time checks on runs, trends and zones (points outside 1 SD or 2 SD), you can choose whether you want mean and zone calculations to be based on control limits or gate limits.
To change this setting, expand the Run values based on tree and then click Control or Gate.
For information on changing the default setting, see SPC Data Entry.
To set the precision for displaying time stamps, expand this tree and then click Minutes, Seconds or Hundredths of seconds.
For information on changing the default setting, see Calendar and dates.
To view or change this setting, expand the Statistical outliers tree.
Statistical outliers are observations that violate SPC rules.
If you choose to exclude statistical outliers, the out-of-control data points will be displayed as outliers on control charts and on data tables but will be excluded from the statistical calculations.
To include all data points in the statistical calculations, choose All data included.
To exclude from the statistical calculations all data points that fall outside the calculated control limits, choose Data outside Control limits excluded.
To exclude from the statistical calculations all data points that fall outside the calculated control limits as well as data that violates SPC rules for runs, trends or zones, choose Out of Control, runs, trends and zone violations excluded.
For information on changing the default setting, see SPC Statistics.
If your report will include the statistic "Trend crosses at" – which returns the x value where the trend line is expected to cross the closest limit on a trend chart of the retrieved data – then that statistic will be affected by the limits you select here.
Control – If checked, the control limits that have been calculated from the retrieved data may affect the "Trend crosses at" statistic.
Control center line – Does not affect the "Trend crosses at" statistic.
Gate – If checked, the gate limits from the standard for which data is retrieved may affect the "Trend crosses at" statistic.
Gate center line – Does not affect the "Trend crosses at" statistic.
Ind. Gate – If checked, the Ind. Gate limits from the standard for which data is retrieved may affect the "Trend crosses at" statistic.
Ind. Gate center line – Does not affect the "Trend crosses at" statistic.
Spec – If checked, the specification limits from the standard for which data is retrieved may affect the "Trend crosses at" statistic.
Spec center line – Does not affect the "Trend crosses at" statistic.
For information on changing the default settings, see SPC Chart defaults.
To configure the settings for incomplete subgroups and varying subgroup
sizes, right-click the Varying subgroup
size node on this tree. This will display the Incomplete
Subgroups and Varying Subgroup Sizes screen:
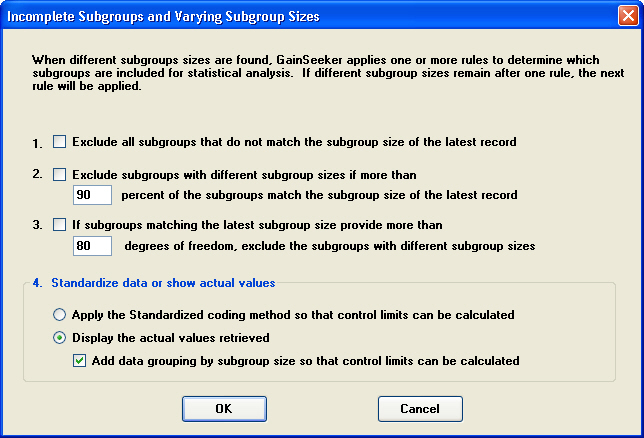
Each time you retrieve data for a standard, GainSeeker will count the number of measurements stored for each subgroup in the retrieval. If you retrieved data with incomplete subgroups or multiple subgroup sizes, the number of measurements per subgroup will not be identical for all subgroups in the retrieval, and GainSeeker will use the settings on this screen to determine how statistics will be calculated on this data:
Exclude all subgroups that do not match the subgroup size of the latest record
With this setting, GainSeeker will count the number of measurements stored
for the most recent subgroup in the retrieval. Any subgroups that contain
a different number of measurements will be displayed on charts and data
tables but temporarily excluded from statistical calculations.
If you select this check box, GainSeeker will ignore all other settings
on this screen and make them unavailable.
Exclude subgroups with different subgroup sizes if more than n percent of the subgroups match the subgroup size of the latest record
With this setting, GainSeeker will count the number of measurements stored for the most recent subgroup in the retrieval. It will then analyze the percentage of subgroups in the retrieval that contain this number of measurements:
If more than n percent of the subgroups in this retrieval also contain this number of measurements, then any subgroups that do not contain this number of measurements will be displayed on charts and data tables but temporarily excluded from statistical calculations.
If the number of subgroups in this retrieval is less than or equal to the percentage you specify here, GainSeeker will not use this setting to exclude data from statistical calculations. Instead, it will proceed according to the options you have configured for settings 3 and 4 below.
If subgroups matching the latest subgroup size provide more than n degrees of freedom, exclude the subgroups with different subgroup sizes
The "Degrees of Freedom" statistic is based on the number of data values being analyzed and the number of subgroups being analyzed. It helps you determine whether you are including enough data values and subgroups to provide a valid statistical sample and is calculated as follows:
DFi = Degrees of Freedom for subgroup number i
For a subgroup with n data values (where n > 1): DFi = n - 1
For a subgroup with 1 data value: DFi = 1
For a subgroup with 0 data values: DFi = 0
DF = Degrees of Freedom for the subgroups being analyzed
k = the number of subgroups being analyzed
DF = DF1 + DF2 + ... + DFk
With this setting, GainSeeker will count the number of measurements stored for the most recent subgroup in the retrieval. It will then calculate the degrees of freedom for subgroups in the retrieval that contain this number of measurements:
If the subgroups containing this number of measurements provide more than n degrees of freedom, then any subgroups that do not contain this number of measurements will be displayed on charts and data tables but temporarily excluded from statistical calculations.
If the subgroups containing this number of measurements do not provide more than n degrees of freedom, GainSeeker will not use this setting to exclude data from statistical calculations. Instead, it will proceed according to the options you have configured for setting 4 below.
Standardize data or show actual values
With these two options, no subgroups are excluded from statistical calculations:
Apply the Standardized coding method
If you choose this setting, GainSeeker will use the Standardized coding method to display modified data values on charts and use these modified values to calculate statistics such as control limits.
Display the actual values retrieved
If you choose this setting, GainSeeker will display the actual measurements and subgroup averages on charts.
Because you are analyzing data with different numbers of measurements in the subgroup without using a coding method to accommodate the difference in subgroup sizes, GainSeeker will not be able to calculate some statistics – like Cpk or control limits – for the entire retrieval. However, if you select the Add data grouping by subgroup size check box, then GainSeeker will begin a new data group each time the subgroup size changes. This will allow GainSeeker to calculate statistics such as the data mean and control limits separately for each data group.
For information on changing the default setting, see SPC Statistics.
If you want to analyze this data as if its standards were configured differently – without actually changing those standards – then you can expand the Standard overrides tree and change the desired settings.
Some of the standard settings will impact the statistics that you report in different ways. These standard settings can be grouped as follows:
Settings that will only change the statistic that reports that standard setting:
|
Standard override |
Affects |
|
Data entry constant |
|
|
Description |
|
|
DMS Part Number |
|
|
DMS Process |
|
|
Limits \ Lower reasonable limit |
|
|
Limits \ Upper reasonable limit |
|
|
Limits \ Target R |
|
|
Meas. system |
|
|
Meas. unit |
|
|
Miscellaneous \ |
|
|
Miscellaneous \ |
|
|
Part Number/Process |
|
|
Real-time checks |
|
|
Scaling \ Scale high range |
|
|
Scaling \ Scale high X-Bar |
|
|
Scaling \ Scale low X-Bar |
|
|
Standard subgroup size |
|
|
Standard variables 1-4 |
Settings that will also affect the numeric formatting of some other statistics (in addition to changing the statistics that report these standard settings):
|
Standard override |
Affects |
Also affects the numeric formatting |
|
Decimal places |
||
|
Exponent |
(when Use Exponent is checked |
|
|
Use exponent |
Settings that will also affect the calculation of some other statistics (in addition to changing the statistics that report these standard settings):
|
Standard override |
Affects |
Also affects the calculation |
|
Limits \ Lower Gate |
||
|
Limits \ Lower Ind. Limit |
||
|
Limits \ Lower range Gate |
||
|
Limits \ Lower Spec |
||
|
Limits \ Target X |
||
|
Limits \ Upper Gate |
||
|
Limits \ Upper Ind. Limit |
||
|
Limits \ Upper range Gate |
||
|
Limits \ Upper Spec |
||
|
Range chart |
||
|
Miscellaneous \ |
For more information on individual settings in standards, see Creating and editing standards.