
Traditional SPC only sees a slice of your process, and problems can start and grow in the gaps between manual samples. Continuous, IoT-driven monitoring closes that gap by feeding gauge and sensor data straight into your SPC system as it's generated. The statistics stay the same (control charts, Cp/Cpk, control limits), but shifts become visible much faster. GS Premier connects to shop-floor devices via RS232 and to ERP/MES systems via API, while AskGS turns the data stream into real-time alerts and root-cause answers without the alert fatigue. Learn how to make the move from periodic sampling to real-time SPC, and when manual sampling still makes sense.
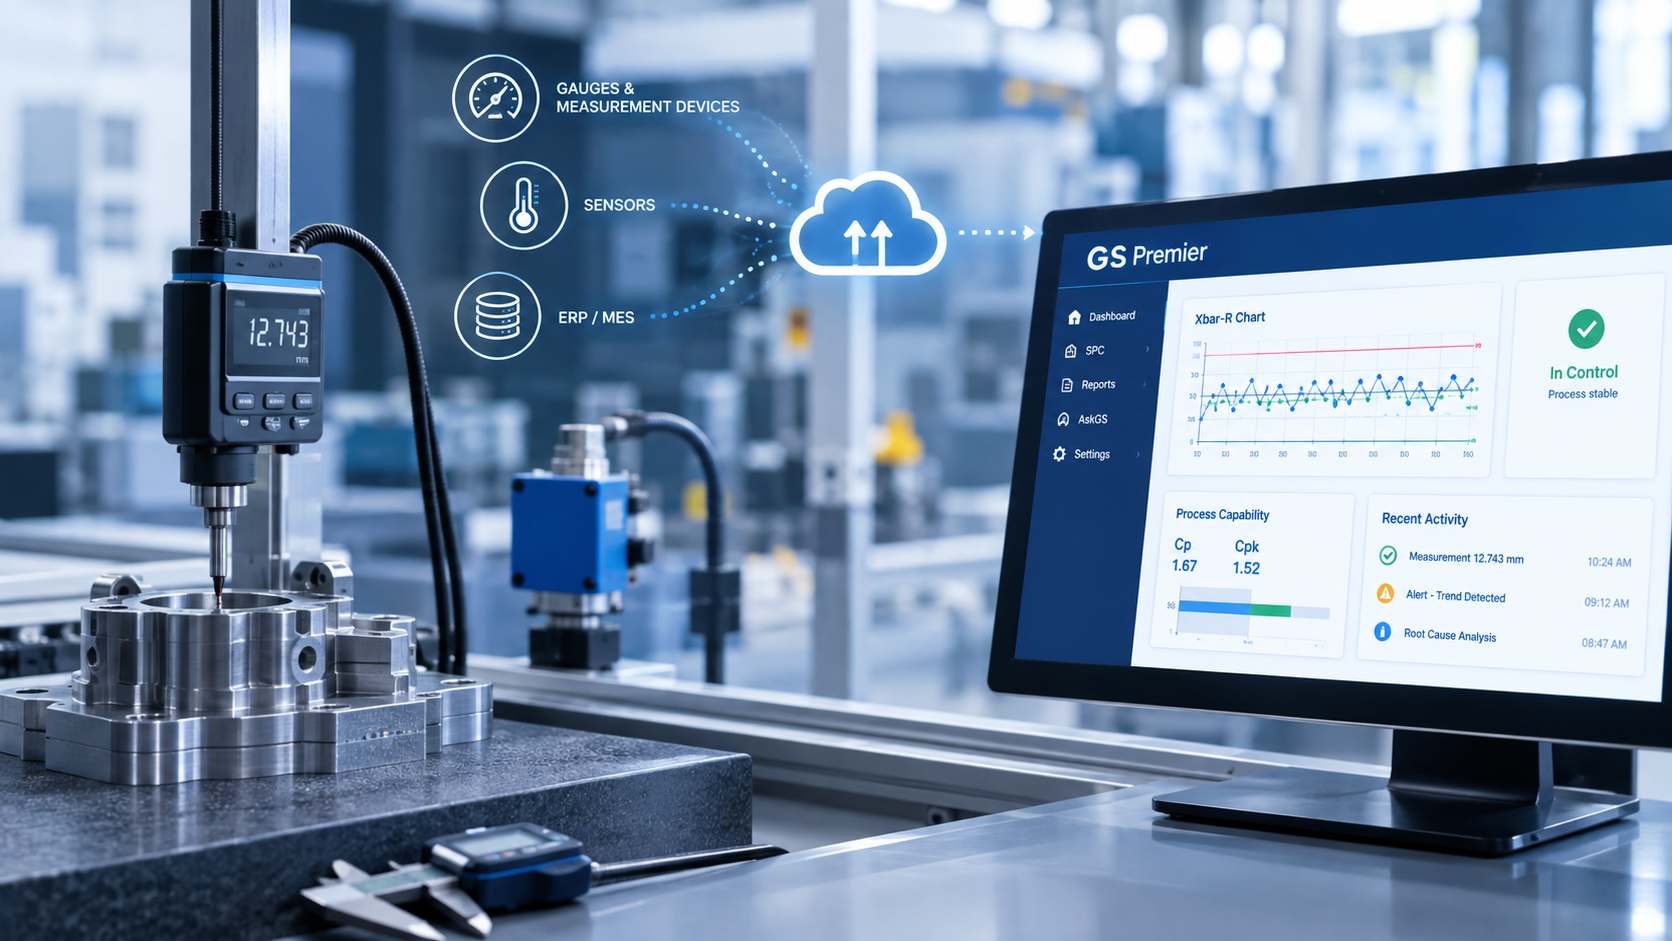
SPC in the IoT era means moving from periodic manual sampling to continuous, connected data collection. GS Premier, Hertzler's cloud-based SPC platform, connects to shop-floor measurement devices and existing ERP/MES systems, then uses AskGS to turn that continuous stream into real-time alerts and root-cause answers, without replacing the statistical foundation of SPC.
Traditional SPC relies on periodic sampling: an operator pulls a part every so often, records a measurement, and plots it on a control chart. That approach works, but it only ever sees a slice of the process, and the gap between samples is where problems can start and grow before anyone notices.
Continuous monitoring closes that gap. Connected gauges and measurement devices feed data into the SPC system as it's generated, rather than in the batches an operator has time to record by hand. The statistical tools don't change: you're still building control charts, calculating Cp and Cpk, and watching for out-of-control signals. What changes is how much data feeds those tools, and how quickly a shift becomes visible.
On a connected shop floor, real-time SPC data typically comes from digital measurement devices, calipers, micrometers, and other gauges with digital output, along with dimensional, temperature, and pressure sensors tied into process equipment. The common thread is a digital signal the SPC system can capture automatically, instead of someone reading a dial and writing down a number.
For GS Premier specifically, the most direct path from device to dashboard is RS232 measurement input: shop floor gauging connects straight into the platform, so a reading becomes a data point without manual entry.
The underlying statistics of SPC don't change with more data, but a few things need to be handled deliberately when data arrives continuously instead of in periodic samples:
In most cases, existing SPC software needs to connect to more data sources, not be replaced. GS Premier connects directly to RS232 measurement devices on the shop floor, offers a documented API for linking ERP and MES systems, and can be extended with JavaScript to reach other applications, with local file import available as well.
That combination means a manufacturer can bring device-level data, business-system data, and manual entries into a single SPC and quality management view, rather than running separate tools for separate data sources.
No. Continuous monitoring gives you more data points, not a different way of judging them. Control limits are still what separate normal process variation from a real signal that something has changed. Without them, a constant stream of readings is just noise on a screen: more data to look at, but no more clarity about what to act on.
What continuous data does change is how quickly a limit violation gets caught. A shift that would have sat undetected between two manual samples now shows up in the next reading.
More data means more potential alerts, and a flood of low-value notifications trains people to ignore all of them, including the ones that matter. Avoiding that starts with alerting on real control-limit violations and meaningful trends, not on every fluctuation within normal variation.
GS Premier's real-time alerts are built around process deviations rather than raw data noise, so notifications flag genuine out-of-control conditions. AskGS, the conversational AI built into GS Premier, adds another layer: it generates predictive summaries of process stability that can identify a developing shift or trend before it ever triggers a formal alarm, and cross-references operator, machine, and part data to explain why a shift happened rather than just flagging that one did. That turns an alert into an answer, instead of one more thing to investigate manually.
Continuous, connected monitoring is the better fit for most manufacturers moving beyond paper-based or spreadsheet-based sampling:
Periodic manual sampling still has a place for low-volume or low-risk characteristics where continuous data collection isn't justified. For most production lines feeding regular quality decisions, though, continuous monitoring catches what manual sampling is structurally built to miss.
The fastest way to know how continuous monitoring would work on your floor is to see GS Premier running against your actual process data, not a generic demo script. Request a live demo, and a Hertzler quality specialist will walk through how the platform connects to your existing gauges and systems, how quickly your team could move from periodic sampling to real-time SPC, and what AskGS would surface from your own data.
Request a Demo of GS Premier at www.hertzler.com/request-a-demo.

Phil Mason, MBA (September 2026): Phil joined Hertzler Systems Inc. as VP of Business Development in January 2010 and was named President in June 2026.
Links: LinkedIn Quality Magazine FinalScout


